Set up PHP With Docker, PHPStorm, and XDebug
Published by marco on
Until now, PHP debugging involved a fragile balance between the IDE, the server, and the debugger, each with overly verbose configuration. On top of that, using Docker introduced the wrinkle that you were technically debugging on a remote server rather than on the “real” localhost.
It’s been a long journey, but it’s finally a lot easier to set up PHP debugging with a server running in a Docker container. Once you use the most modern tools, everything works with a couple of lines of configuration.
tl;dr:
- Ignore anything you find on StackOverflow from before November of 2020 and use the install-php-extensions project instead (see example below).
- Set environment variables in the docker-compose file to indicate the client and the default mode (debug)
- Use the latest PHPStorm, which supports XDebug 3.x
My setup is as follows:
- PHPStorm 2020.3.1 running on MacOS
- Docker 3.0.4 running on MacOS
- “db” container running MySql 5.7.24
- “web” container running PHP 7.2.24 on Apache
So far, so good: it’s basically a standard developer setup for PHP where I have an IDE on my machine and am running servers in Docker containers. XDebug initiates a connection from the server in the “web” container back to the IDE on the docker host.
Without further ado, these are the magic configuration files to install extensions and set up XDebug for PHP.
web/Dockerfile
After much searching and rigamarole and fighting with docker-php-ext-install and docker-php-ext-enable and PECL and where the PHP.INI is and whether I need to move one of the default files somewhere so that PECL can update it and downloading dependencies with apt-get and getting the right dependencies, depending on the PHP version and passing the right flags to docker-php-ext-configure if the version is a bit older and, and, and…
After trying a ton of no-longer-relevant and now-overly-complex suggestions on StackOverflow, I finally returned to php on dockerhub and discovered a hint to use the install-php-extensions project, which basically takes care of everything for you.
It does. End of story.
FROM php:7.2.24-apache

ENV DEBIAN_FRONTEND=noninteractive

ADD https://github.com/mlocati/docker-php-extension-installer/releases/
latest/download/install-php-extensions /usr/local/bin/

RUN chmod +x /usr/local/bin/install-php-extensions && sync && \
    install-php-extensions gd xdebug mysqli exif zip
I pin the PHP version to the one on my server, download the latest version of install-php-extensions[1] and then call it to install the non-standard extensions I use on earthli:
exif: Extract date information from picturesgd: Generate thumbnailsmysqli: Provide access to MySql using a legacy APIxdebug: Debugging support on the serverzip: Open and read files from ZIP archives
See the web site for the list of supported packages. Your site will likely use different ones (but you should definitely install xdebug because it’s totally easy to use now).
docker-compose.yaml
Finally, you just need to set two environment variables to enable debugging for PHP:
XDEBUG_CONFIG: accepts a list of settings, but we only need to set theclient_hostto tell XDebug which machine hosts the IDE to which to connect (Docker handily provides thehost.docker.internalalias for MacOS and Windows)XDEBUG_MODE: this sets up the tool for step-debugging (see XDEBUG mode for more information).
I’ve included nearly the full Dockerfile from earthli, but the only relevant part for debugging is in the environment.
  web:
    build: web
    container_name: "${COMPOSE_PROJECT_NAME}-web"
    restart: unless-stopped
    ports:
      − 80:80
    volumes:
      − ../site:/var/www/html
      − ../lib:/var/tmp/earthli.com-lib
      − ../../earthli-webcore/site:/var/tmp/webcore-site
      − ../../earthli-webcore/lib:/var/tmp/webcore-lib
      − ../../earthli-data:/var/tmp/earthli-data
      − ../../earthli-logs:/var/tmp/logs
      − ../config/apache-dev.conf:/etc/apache2/sites-available/000-default.conf
    depends_on:
      − db
    environment:
      XDEBUG_CONFIG: client_host=host.docker.internal
      XDEBUG_MODE: debug
PHPStorm and Browser
At this point, you’re well on your way to debugging with PHPStorm. From here, follow the instructions in the settings dialog, shown below.
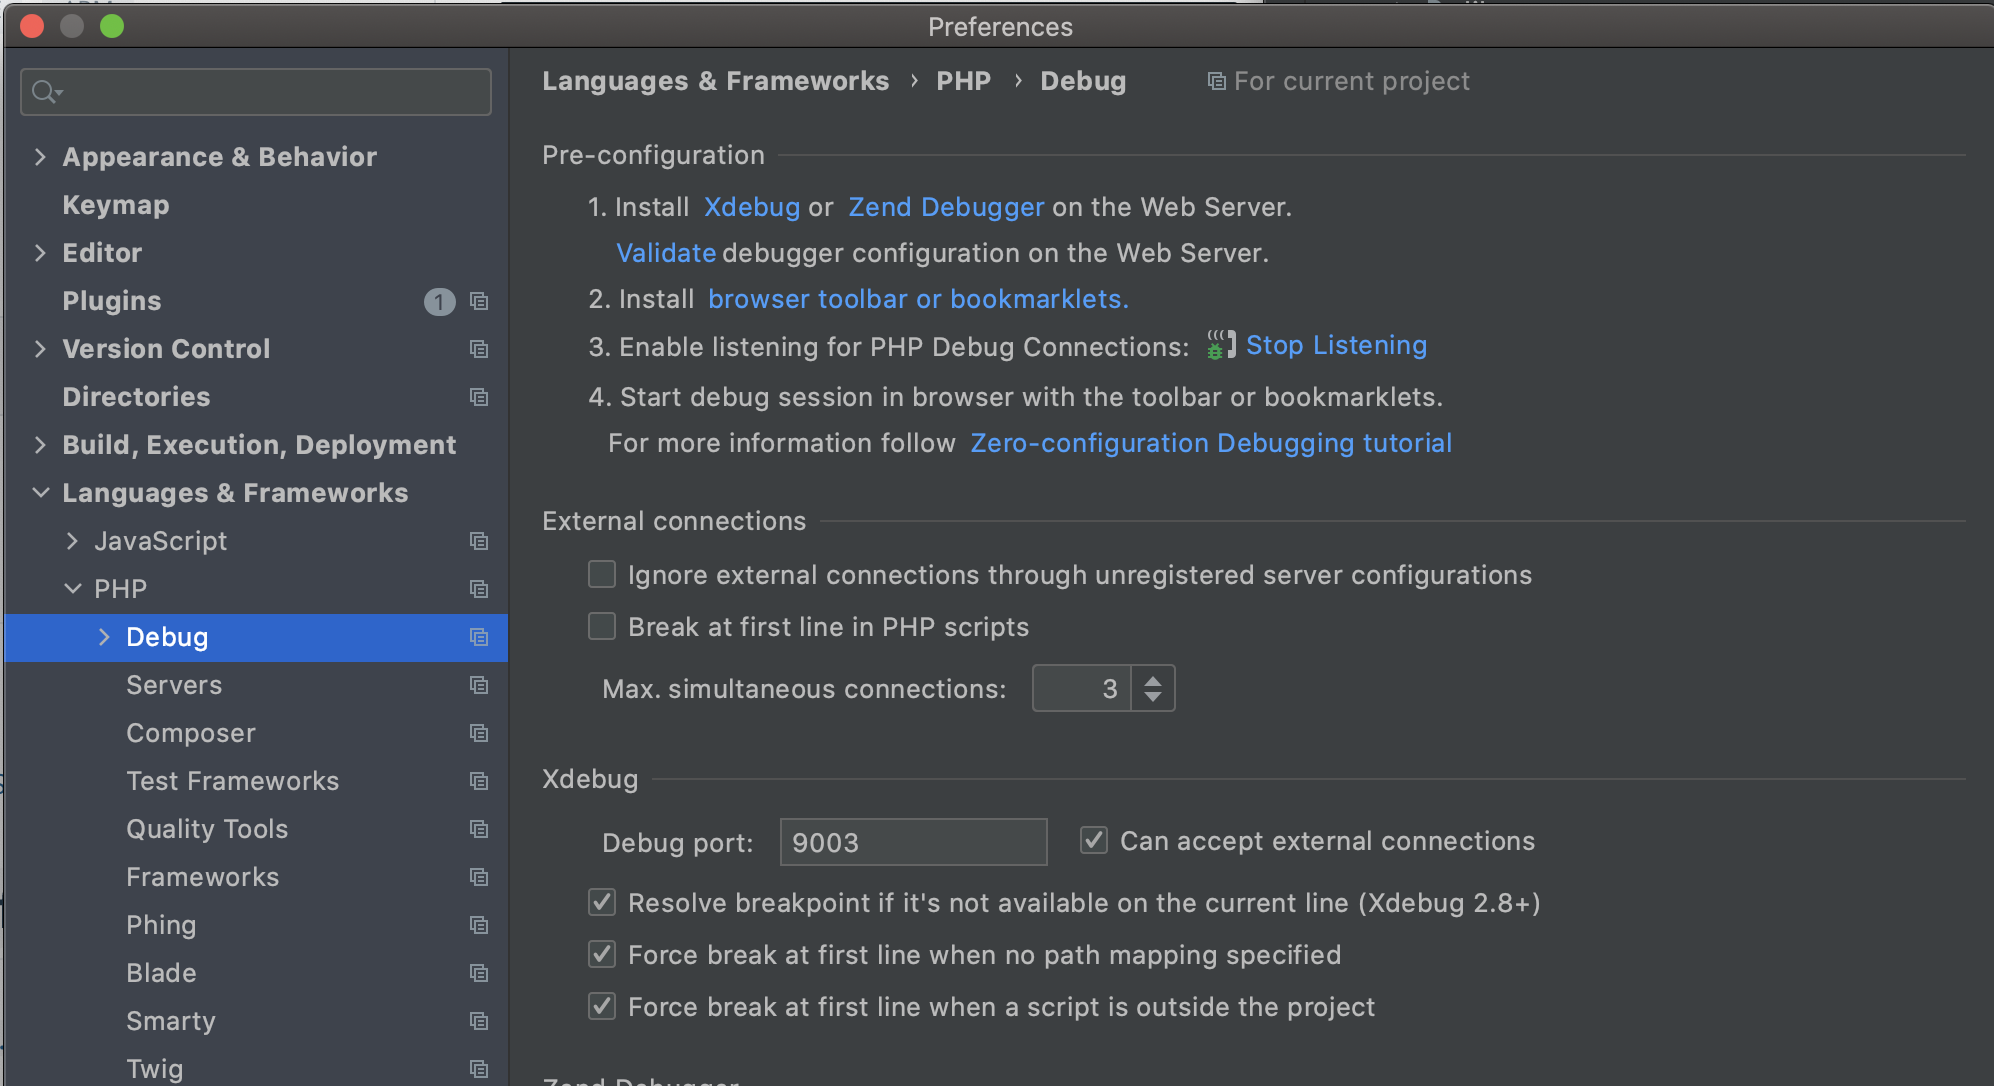
- You can click the “Validate” link in the dialog to verify that your XDebug is recognized and working in principle
- Activate step debugging from the browser. You can pass
XDEBUG_SESSION=PHPSTORMin the query string, but that gets a bit tedious. Instead, install a browser-debugging extension, which simply injects the cookieXDEBUG_SESSION=PHPSTORMinto the request so that PHPStorm knows that debugging is desired. See XDebug’s documentation for more information on other ways of triggering debugging, including from the command line (e.g. when running unit tests). - Make sure PHPStorm is listening for incoming PHP Debug Connections (you can toggle in the dialog shown above or from the toolbar in the IDE).
That’s it. A long and kind of painful journey has finally led to a solid and easy-to-configure debugging experience for PHP.
[1] I will probably pin the version to the one I’m using right now because I know it works.↩