Saving & Loading Performance in Quino
Published by marco on
This article was originally published on the Encodo blogs and cross-published here.
The GenericObject in Quino had recently undergone a performance overhaul, as documented in the article, Improving performance in GenericObject…but we weren’t finished yet.
I’m going to assume that you read the overview on “How Data Objects are Implemented” and understand what the GenericObject actually is. In the other article, we optimized performance when creating objects in-memory and when loading and setting values. Those optimizations were driven by an application that used Quino data in a highly specialized way. In this article, we address other performance issues that came up with another Quino application, this one a more classical client for a database.
To be more precise, the performance of the Quino application itself was satisfactory, but an importer for existing customer data was so slow as to be almost useless for testing—because it took hours instead of minutes.
So out came the YourKit Profiler for .NET again. As mentioned in the other article, we ran a part of the tests below (the smallest dataset) with tracing enabled, had YourKit show us the “Hot Spots”, fixed those. Rinse, lather, repeat.
Charts and Methodology
As to methodology, I’m just going to cite the other article:
“The charts below indicate a relative improvement in speed and memory usage. The numbers are not meant to be compared in absolute terms to any other numbers. In fact, the application being tested was a simple console application we wrote that created a bunch of objects with a bunch of random data. Naturally we built the test to adequately approximate the behavior of the real-world application that was experiencing problems. This test application emitted the numbers you see below.”
Note: The vertical axis for all graphs uses a logarithmic scale.
Even though the focus was not on optimizing performance of creating objects in memory, we managed to squeeze another 30% out of that operation as well. Creating objects in memory means creating the C# object and setting default values as required by the metadata.
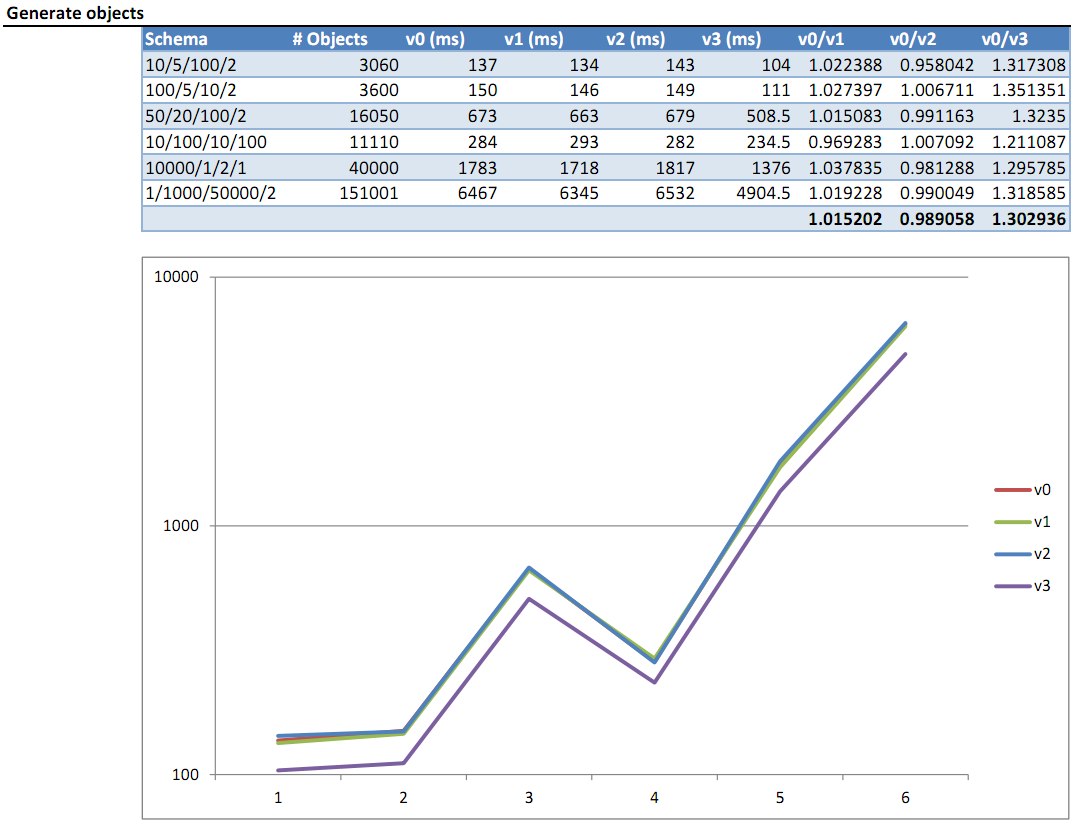 Creating New Objects in Memory
The “Saving New Objects to PostgreSql” test does not indicate how many objects can be saved per second with Quino. The data is based on a real-world model and includes some data on a timeline, the maintenance of which requires queries to be made after an object is saved in order to maintain the integrity of the timeline. So, the numbers below include a lot of time spent querying for data as well.
Still, you can see from the numbers below that saving operations got slower the more objects there were. Saving 150k objects in one large graph is now 20x faster than previous versions.
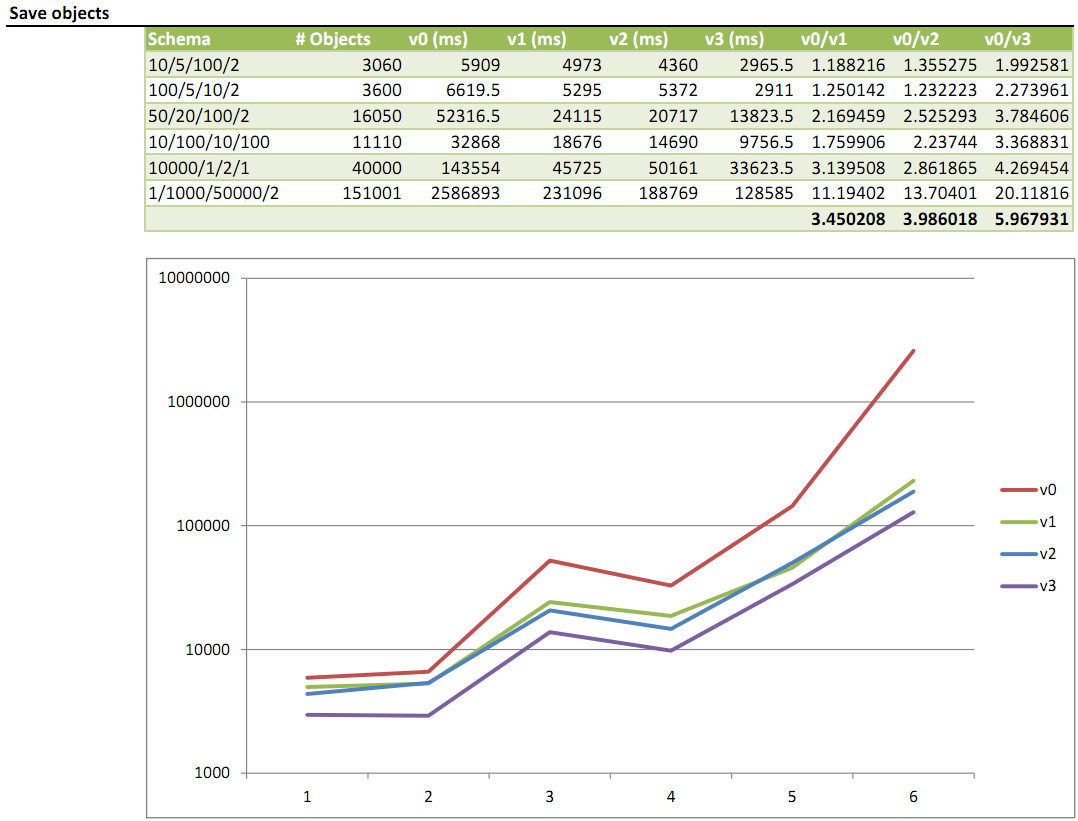 Saving New Objects to PostgreSql
This final number is relatively “clean” in that it really only includes time spent reading data from the database and creating objects in memory from it. That there are more objects in the resulting graph than were saved in the previous step is due to the way the data was loaded, not due to an error. The important thing was to load a lot of data, not to maintain internal consistency between tests.
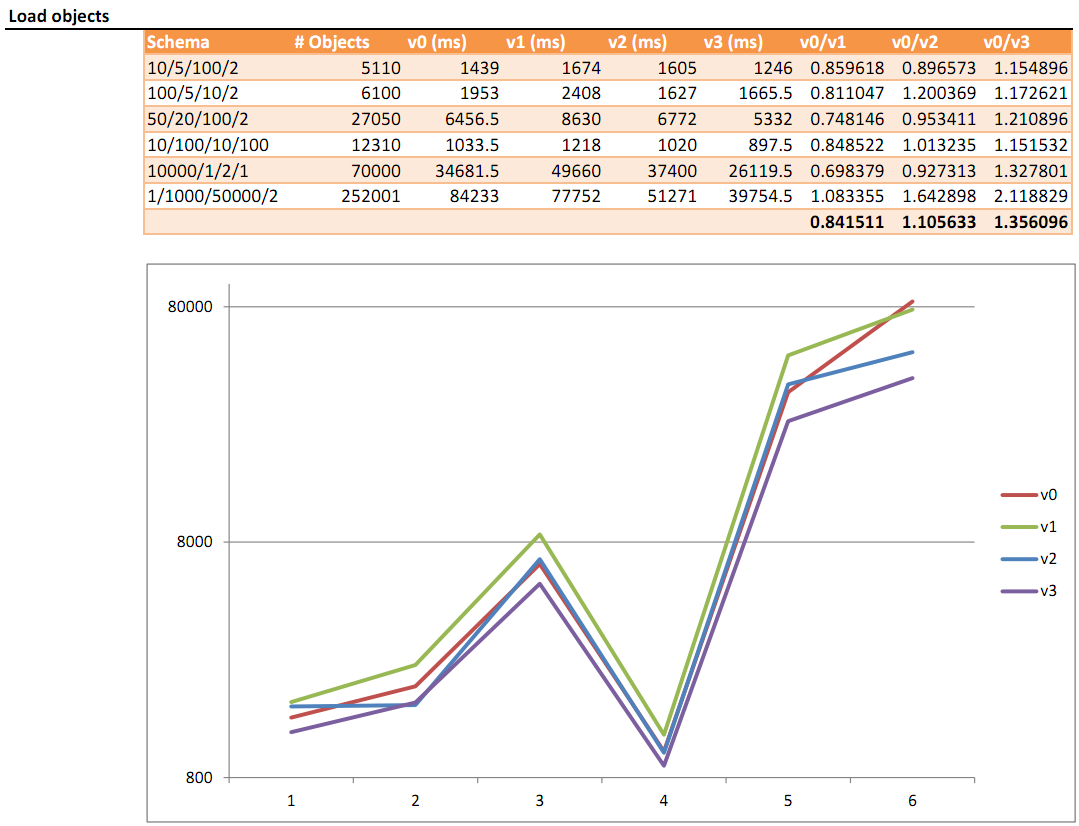 Loading Objects from PostgreSql
Again, though the focus was on optimizing save performance, loading 250k objects is now twice as fast as it was in previous versions.
These improvements are available to any application using Quino 1.6.2.1 and higher.