Configuring and using Jetbrains Rider 2021.1.1 and Visual Studio 2019 16.9.4
Visual Studio with ReSharper has been my main development tool for many, many years. I first started using it in 2008 or 2009.
Over the last several years, I’ve used many other IDEs, like Visual Studio Code for documentation, advanced search, and JavaScript/TypeScript or PHPStorm for PHP, Android Studio for Java/Android, XCode for Swift/iOS, or WebStorm for TypeScript/JavaScript.
JetBrains Rider came on the scene several years ago and was not, at first, a viable alternative, but it has gotten much, much better. It now makes sense to consider using Rider as well as or even instead of Visual Studio/R#.
tl;dr: Both IDEs are excellent, if configured properly. Download the solution template to see an example of a solution configuration that includes all settings discussed below.
Initial Visual Studio Setup
Before going into the new setup, let’s briefly discuss what we were replacing.
- Visual Studio Community 2019 16.9.4[1]
- ReSharper 2021.1.1
- StyleCop by JetBrains 2020.3.0
- ReCommended Extension for ReSharper 5.5.0
- Enhanced Tooltip 3.15.0
- Heap Allocations Viewer 2020.3.0
- CyclomaticComplexity 2020.3.0
.EditorConfigused only lightly
All inspections and quick-fixes run through ReSharper. Visual Studio “squiggles” are disabled because they’re distracting and contribute nothing additional. StyleCop does a lot of the heavy lifting, but it does a bit too much. It checks spelling in documentation, even though ReSharper already does that natively.
The biggest drawback is that StyleCop uses its own parser, which is not just detrimental to performance—the Roslyn parser, the ReSharper parser, and the Style Cop parser are all running at the same time—but also the StyleCop parser is no longer compatible with some features of C# 8 and 9. It records “syntax errors” for perfectly valid code.
Initial Rider Setup
Rider doesn’t support the StyleCop, ReCommended, or the Enhanced Tooltip extensions. Not having Enhanced Tooltip isn’t that big a deal (Rider’s tooltips are OK), but not having StyleCop and ReCommended meant a significant number of style and formatting inspections were not applied in Rider.
Rider supports style and formatting, but it doesn’t warn or indicate when there are issues. This makes it more difficult to help developers use a common style.
Requirements
- Get as close to feature parity as possible between Rider and Visual Studio/ReSharper.
- Retain StyleCop’s style and formatting checks, but without the old parser
- Reduce inspection redundancy wherever possible
- Use human-readable and human-maintainable configuration
- Use common confirmation for Rider and Visual Studio/ReSharper
- Use configuration that Visual Studio, but also Visual Studio Code understands wherever possible or advantageous
Approach
StyleCop.Analyzers
The StyleCop.Analyzers project has been around for a while, but making the move is not as straightforward as just installing the package in all projects. You also have to rewrite the configuration. Luckily, they have a good template from which to start and the documentation is very good.
Since the test solution uses Directory.Build.Props, it also made it very easy to include the assembly and configuration for all projects. I created a special version for test assemblies that removes the documentation requirement.
StyleCop.Analyzers has its own JSON configuration, but it uses the .NET-standard rulesets to configure inspection severities.
Removing the StyleCop plugin for ReSharper was not without drawbacks; it removed a few minor goodies to which I’d grown accustomed:
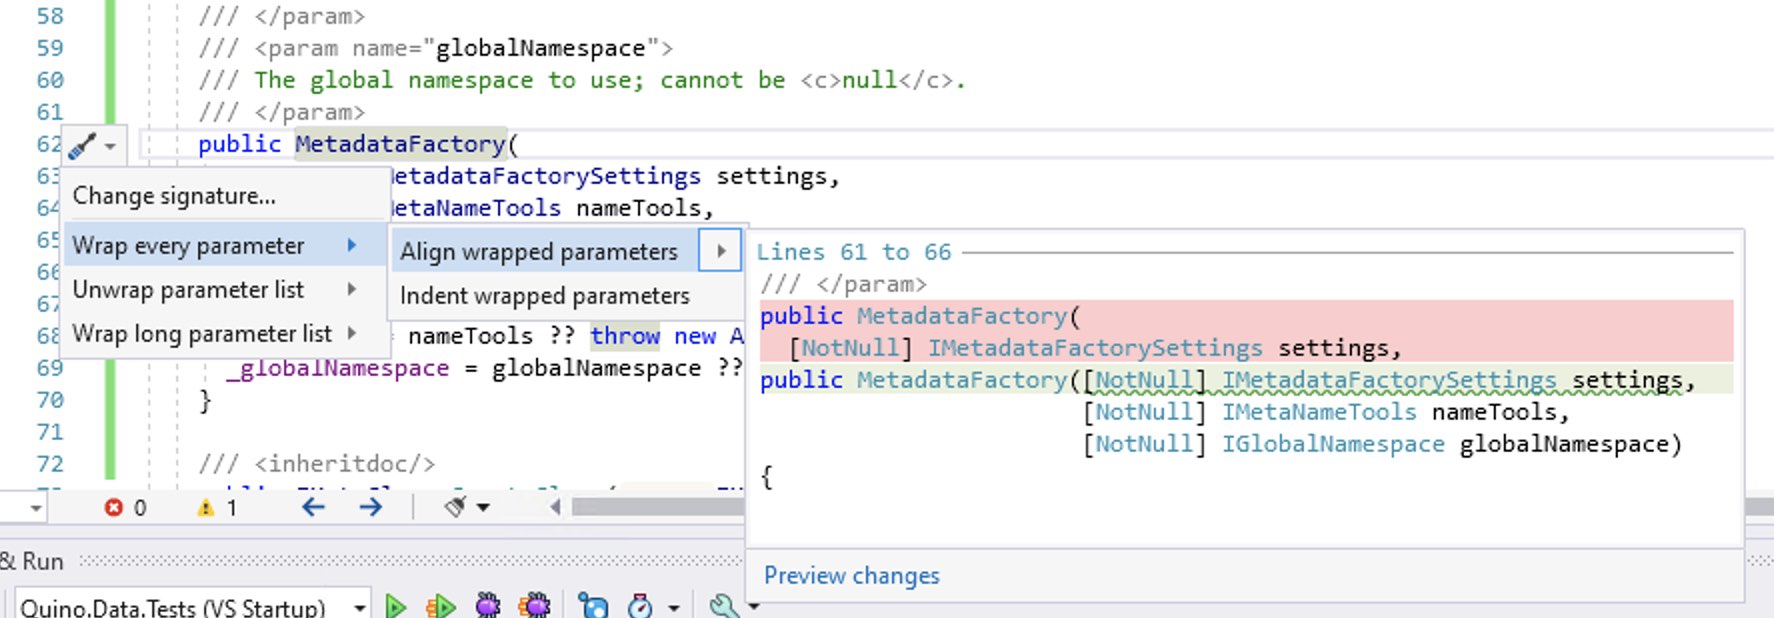
- The “Chop Parameters” quick-fix was nice.
- The “Add documentation” was better than the default in either VS or Rider.
Update 22.04.2021: I’ve since discovered that “chop” is available in Visual Studio by positioning on a method, pressing Ctrl + ., and choosing one of the many wrapping options.
Also, documentation-generation is getting better with each point release.
.EditorConfig
Another standard is using the .EditorConfig file for as much configuration as possible. This format is not IDE-specific: Visual Studio, ReSharper, Rider, Visual Studio Code, and many other editors/IDEs make use of it. Keeping as many settings as possible in this file helps ensure style and formatting is applied correctly no matter which IDE is used. It’s not a guarantee, but there’s a better chance than if these settings are stored in a ReSharper-specific format, as before.
These days, a lot of the configuration can be stored in an .EditorConfig file—all but a handful of the Rider and ReSharper settings are mapped there already and there are a few more with each release.
.Directory.Build.Props
I’m also using SDK-style project files together with the Directory.Build.Props feature of the MSBuild system to consolidate configuration to just one or two files.
Evaluated Setup
Visual Studio:
- Visual Studio Community 2019 16.9.4
- ReSharper 2021.1.1
- ReCommended Extension for ReSharper 5.5.0
- Enhanced Tooltip 3.15.0
Rider:
- Rider 2021.1.1
Shared:
- StyleCop.Analyzers 1.2.0-beta.333
- Heap Allocations Viewer 2020.3.0
- CyclomaticComplexity 2020.3.0
.EditorConfigused for nearly everything
I have not tested Visual Studio without ReSharper because, although Visual Studio has leapt forward in functionality, there are still too many features I miss without ReSharper.[2]
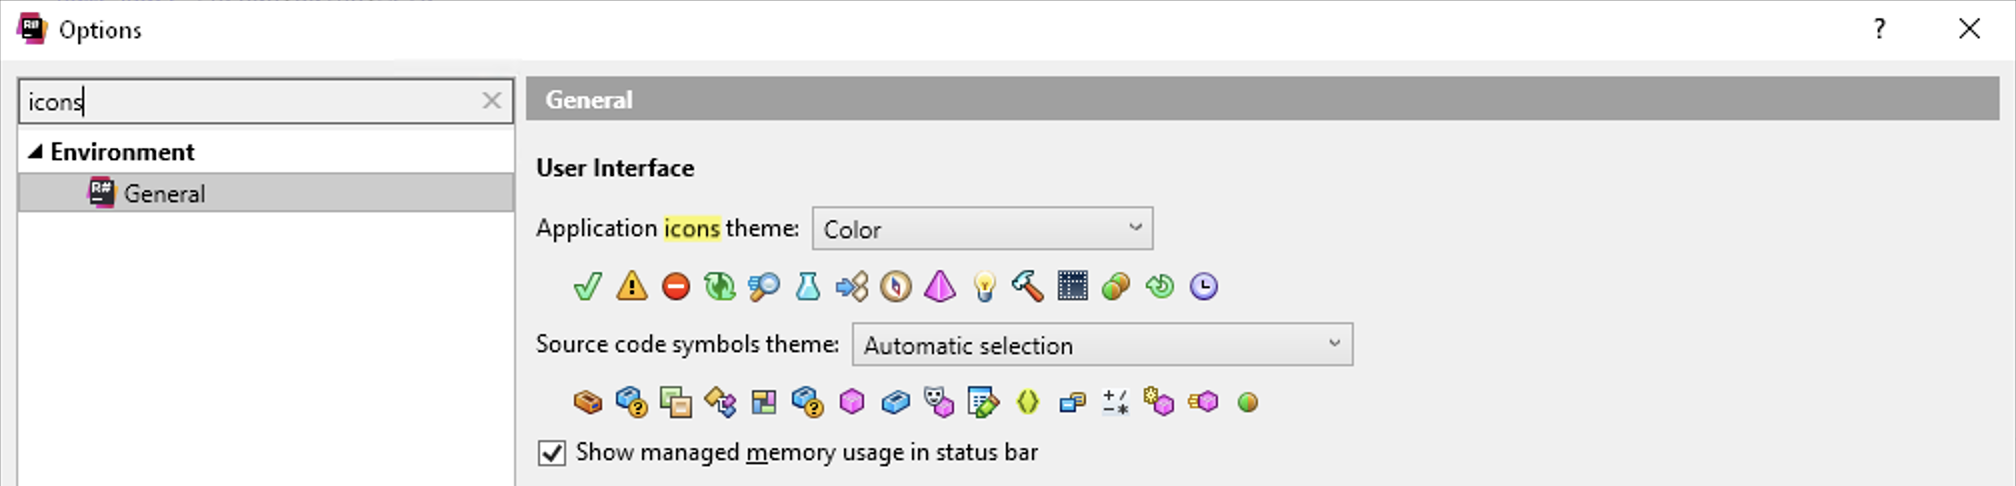
General Options
I use a separate Git client called SmartGit, so I generally turn off as must of the Git integration as possible to save power and memory. The CodeLens (VS)/Code Vision (Rider) is an amazing insight into a ton of statistical information, but I don’t ever use it, so I turned it off. Also, I don’t like how it feels when editing code because it introduces virtual “lines” in too many place. I also would sometimes inadvertently click the links and then have to close detail panels or refocus the editor.
For the same reason, I disable almost all inlay hints in Rider/ReSharper (inline hints in Visual Studio). I do not miss seeing types everywhere. I only care what the actual types are when something doesn’t compile. In Rider, you can long-hold the Ctrl key to show inlay hints on-demand. The only inlay hint I always show is for inherited attributes (e.g. for [NotNull] annotations).
I’ve also disabled Code Folding (Rider)/Outlining (Visual Studio) because I never use it. I don’t need to see the noise along the left-hand gutter and I don’t need to accidentally click the nodes (or accidentally trigger a folding with an inadvertent key combination).
VS/ReSharper Options
- Adjust shortcuts/keysChange color for boxing allocation to orange (default is red)
- ⌘ + W to close a window
- ⌘ + ⌥ + W to close other windows
- ⌘ + ⇧ + W to close other windows
- Disable inlay hints for parameter names
- Disable more inlay hints
- Disable Code Style
- Disable Outlining
- Disable Environment / Intellisense / Automatically show parameter info in …
- Use Package References for NuGet by default
Rider Options
These are options that I ended up changing from the defaults.
- Turn on CamelHumps
- Turn on exception-handling / tune
- Adjust shortcuts/keysChange color for boxing allocation to orange (default is red)
- ⌘ + W to close a window
- ⌘ + ⌥ + W to close other windows
- ⌘ + ⇧ + W to close other windows
- Ctrl+R/Ctrl+G key-combo to the same command as Ctrl+(opt-)+O (Optimize Imports). This command pops up an ominous “Cleaning up Code…” progress dialog for a second but, so far, it seems to be doing only the import-cleanup.
- Alt + < to navigate to methods in the same file
- Change color for matching brace (it’s the same as for selected text, which is very confusing, as it always looked like I’d selected the brace as well)
- Disable inlay hints for parameter names
- Disable more inlay hints
- Disable Code Vision (equivalent to Code Lens in Visual Studio)
- Disable Code Folding
- Disable Editor / General / Code Completion / Show the parameter info popup in …
- Use Package References for NuGet by defaultReduce default font size from 13 to 12
- Reduce default line-spacing from 1.2 to 1.05
Code Style and Formatting
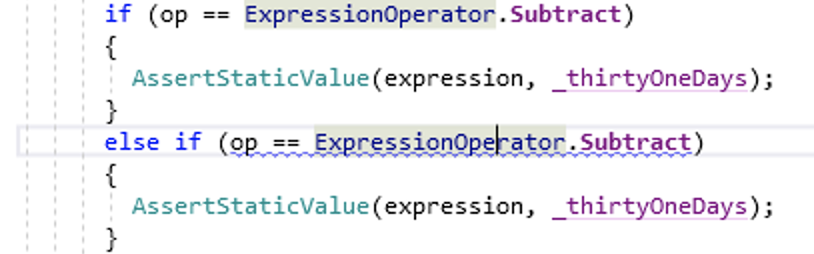
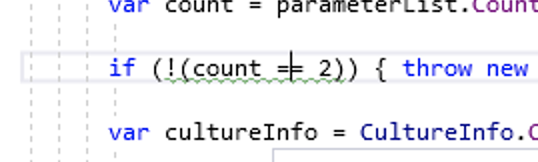
For C# Code style, I ended up adding these extra settings. There are probably others, but these are the ones that made ⌘ + K / ⌘ + D usable for me, especially for the single-line null-check statements that we use a lot.
- Check the box for “Keep existing arrangement of embedded blocks” to prevent reformatting of blocks
- Set the lines to add “After statements with child blocks” to 0
- Set “Wrap invocation arguments” set to “Chop if long or multiline” (I’m not 100% this won’t mess other things up, but it worked a treat in a long test-fixture file)
- Set “Max object and collection initializer elements on a single line” to 1, so he stops reformatting multi-element blocks that we’ve put on multiple lines.
With the first two settings, the formatter won’t fix some things that he would have fixed before, but he’s also not going to change a whole bunch of stuff that you’d rather he left alone.
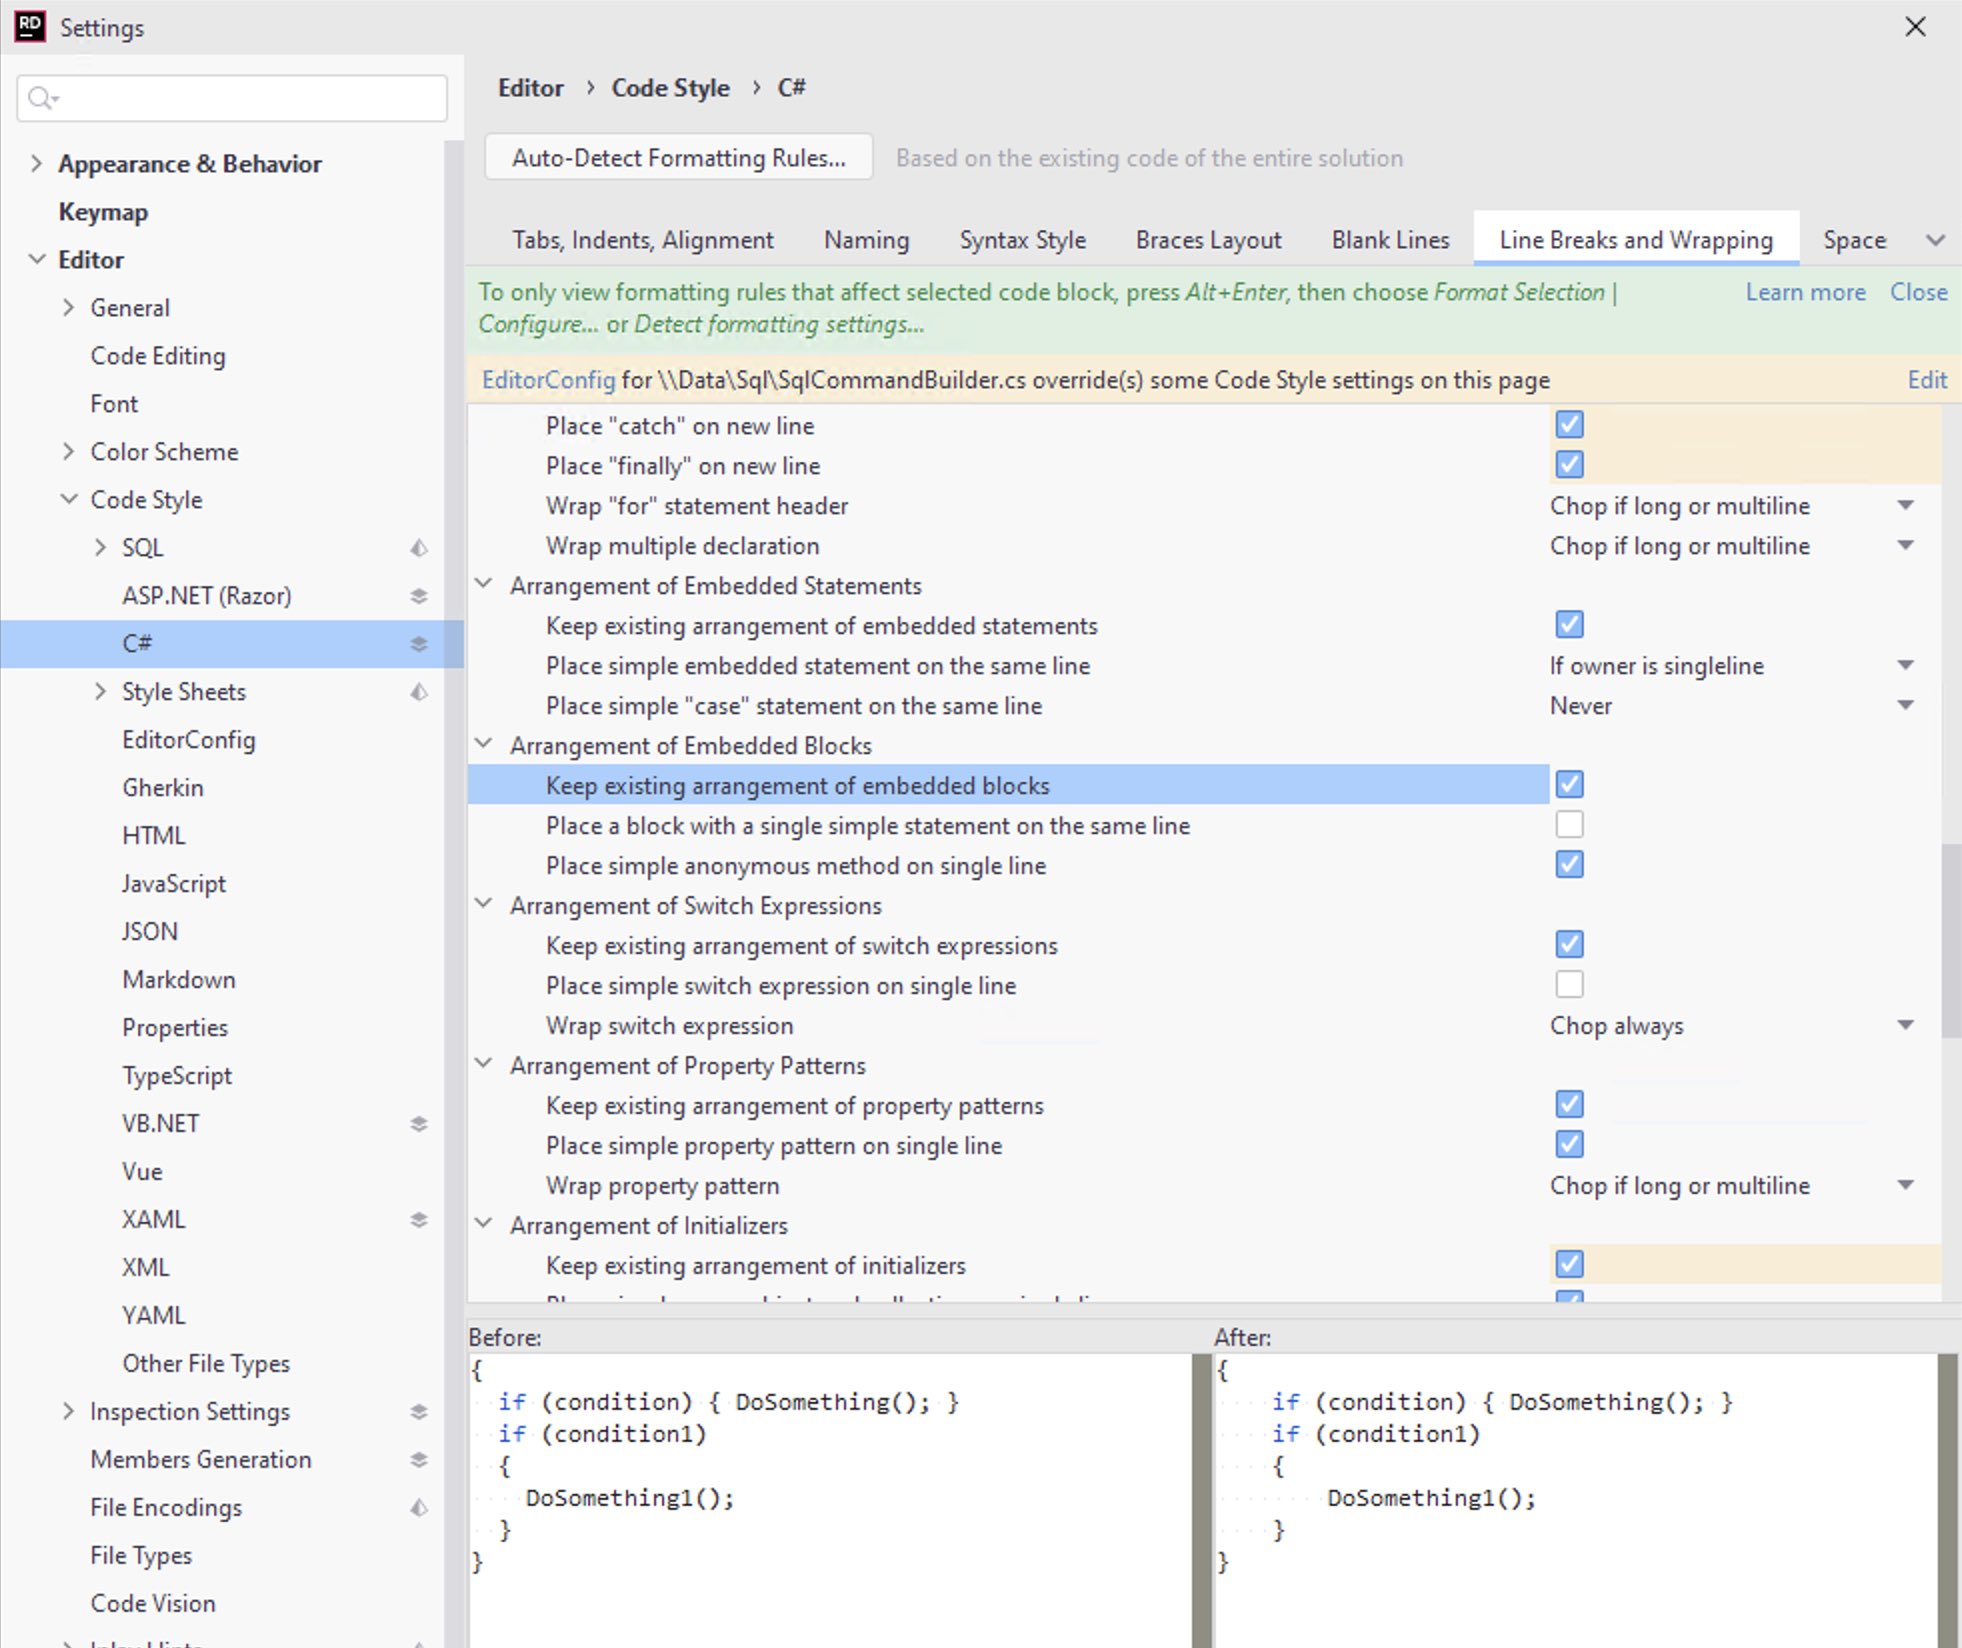 Keep existing arrangements of embedded blocks
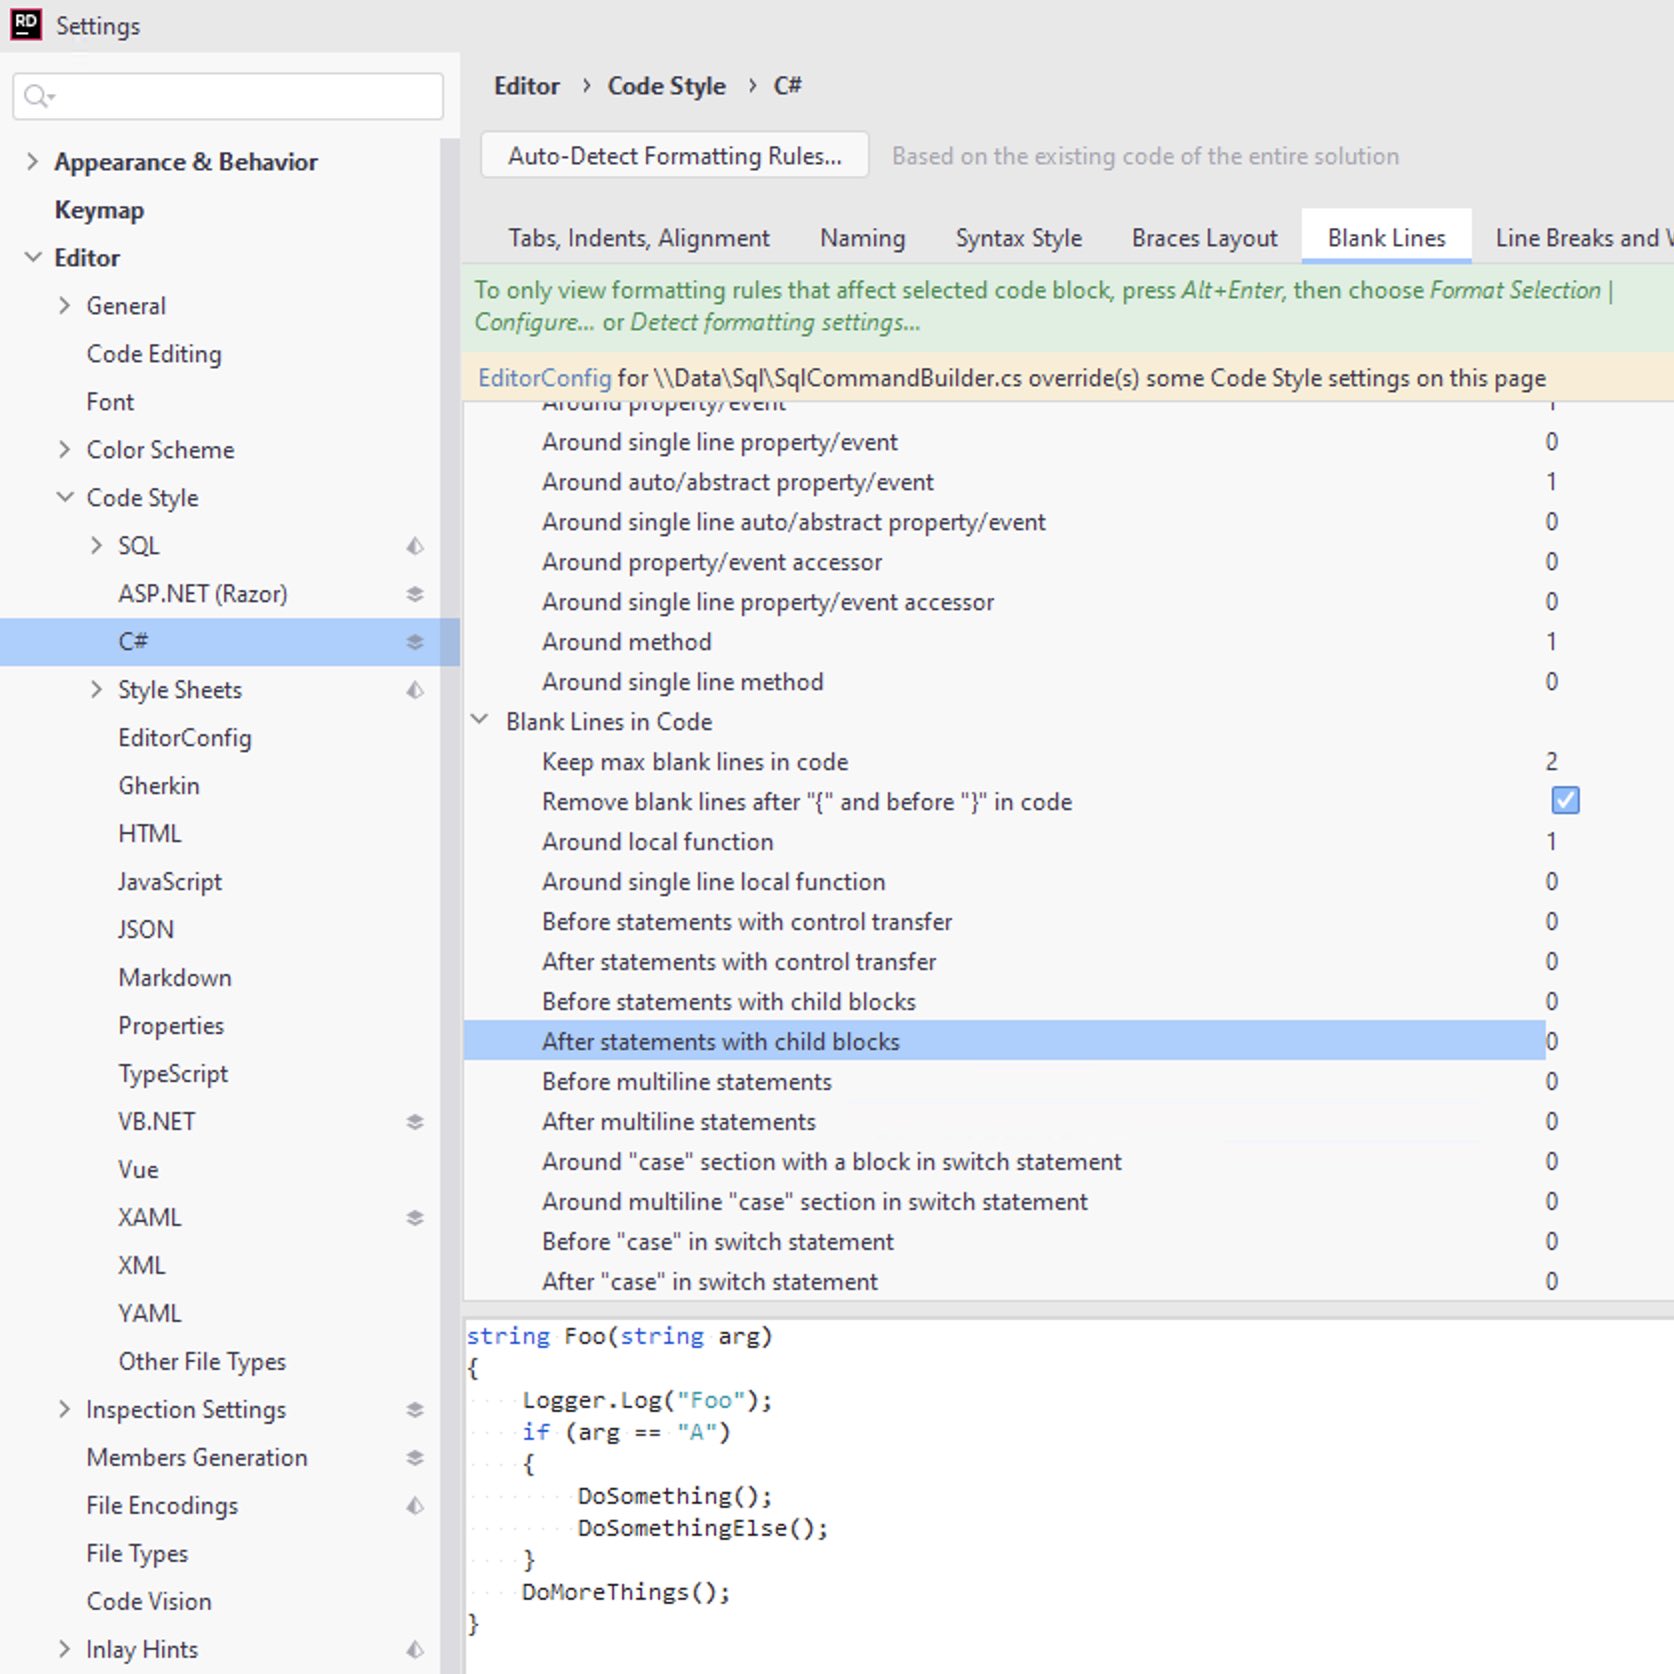 Lines to add after statements with child blocks
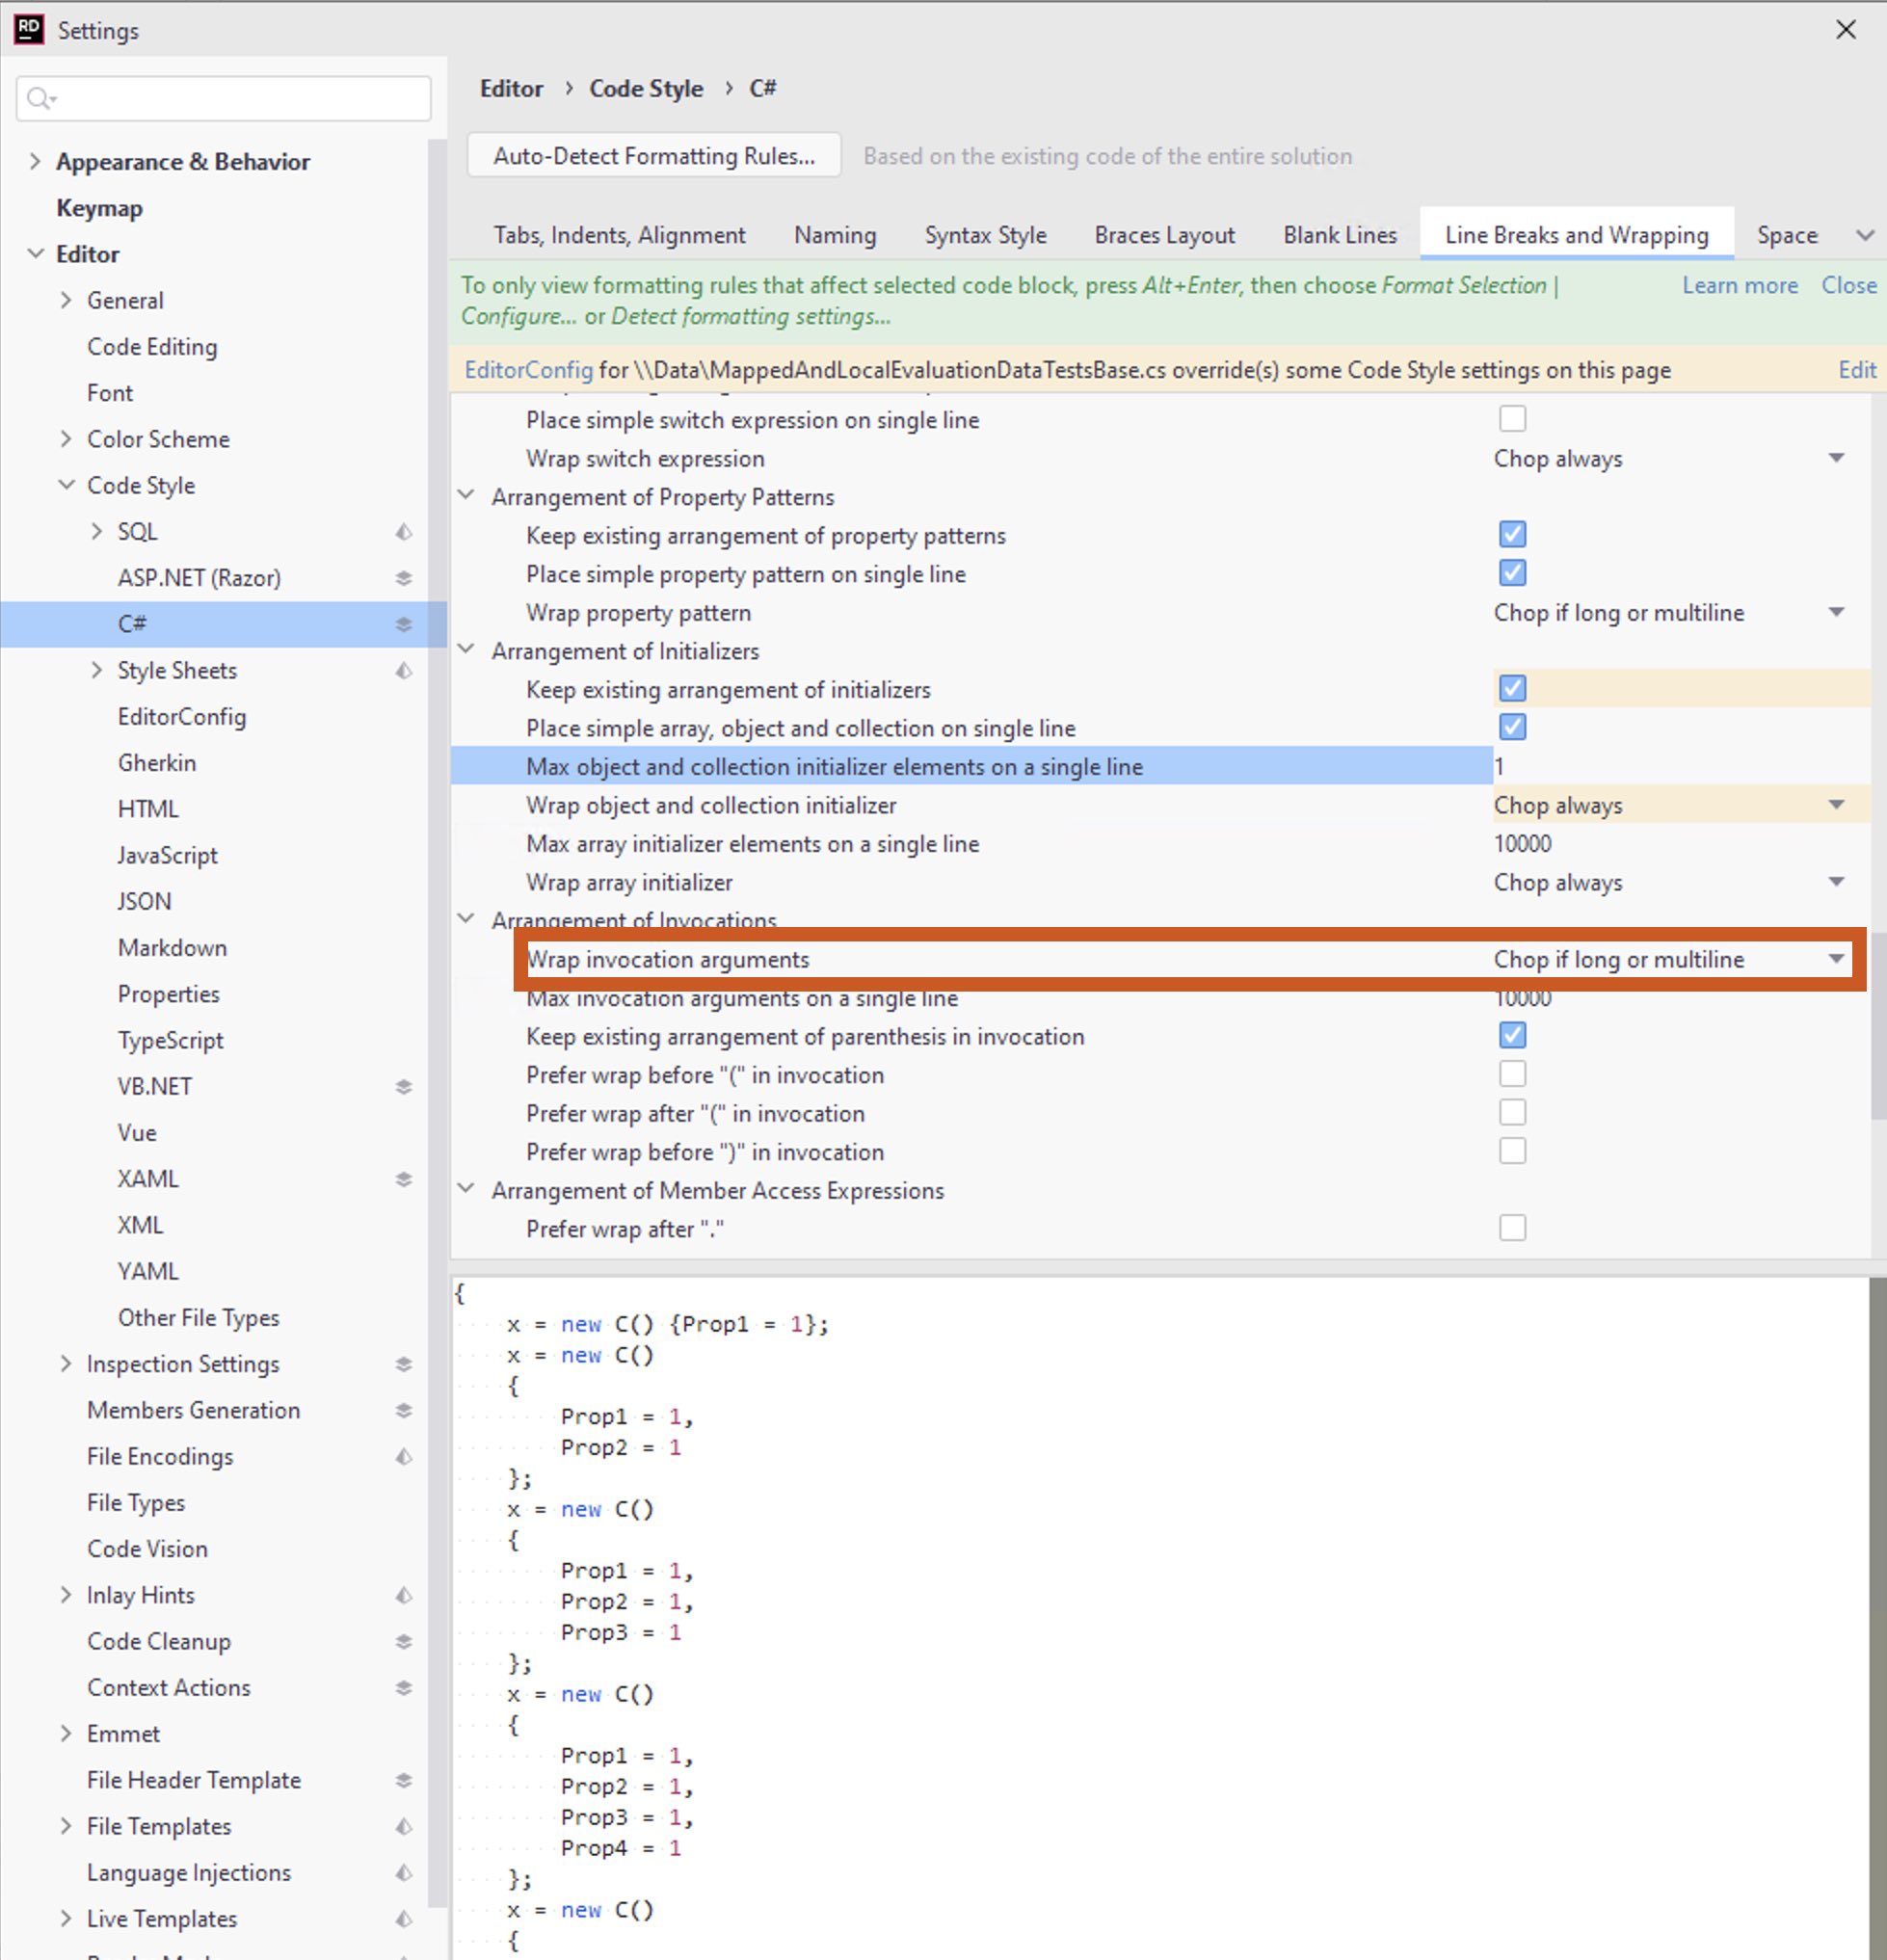 WrapMultipleArguments
It took me a few tries to configure Ctrl+K/Ctrl+D (format document) in Rider, which doesn’t work as loosely as in ReSharper/Visual Studio. In Visual Studio, it leaves single-line argument checks alone. Rider is more … consistent … and reformats all lines, which messes up a lot of formatting.
On the positive side, the configuration for Rider ended up improving “Code Cleanup” in Visual Studio/ReSharper, which had never worked so well before. I eventually figured out how to set things up so that “Format Document” and “Code Cleanup” (Ctrl+E/Ctrl+F) both work flawlessly in Rider and Visual Studio, but it took some time and patience to find all of the settings. The “Detect Formatting Settings” in both ReSharper and Rider were indispensable.
File Layout
I also finally configured the “File Layout” feature so that “Clean Up Code” works as expected. StyleCop Analyzers supports enforcing an ordering on members, but it doesn’t support configuration of that ordering. The order is fixed as StyleCop wants it. Their default style has fields at the top, which is a no-go for our style.
That means that I’ve disabled the “arrangement” feature of StyleCop and no longer see warnings about out-of-order members. This is OK, though, as re-ordering members just to fix a warning is not that great for reviews and merging. “Clean Up Code”, however, does apply the file-layout rules.
I think that this is a better balance overall, as leaving a method in place when you’ve changed its visibility from public to protects (or vice versa) should not earn a warning.
Configuration Files
As noted above, I configured all of the StyleCop, .EditorConfig, and Rider/R# settings to make “format document” and “clean up code” work perfectly with our style. These are just a jumping-off point (even within Encodo). Adjust StyleCop inspection severities in the *.ruleset files.
Adjust formatting preferences in the .EditorConfig whenever you can. Rider/ReSharper will also allow you to override these settings, storing them in the *.sln.DotSettings file, but it’s clearer and more consistent to configure the ruleset and .EditorConfig files because those are more human-readable and better-documented than the *.sln.DotSettings file.
Tip: Download the solution template to see an example of the configuration with all settings discussed above.
Comparison
I made this comparison over the last 4 months, during which the setup changed slowly into the configuration outlined above. I have tried to weed out the notes and impressions that no longer apply, but I may have missed some. I do my best to give the impression of what it’s like to work with these IDEs. I left some longer descriptions in place, just to give a feel of what I experienced while using the IDEs.
Launch and Processes
For small-to-medium projects on a my 4-year-old desktop, you barely notice startup. For the larger Quino project, with over 120 projects (for now), startup speed is more noticeable.
All of the IDEs start relatively quickly now. They’re just fast in different places. It really depends on where your focus is. Visual Studio by itself starts very, very quickly. The latest versions of ReSharper start up in parallel, so VS is on the screen and the editor is typable in seconds, even with a solution like Quino. You can’t search at that point, though.[3]
Rider looks like it’s totally up and running, but it mostly can’t search either, not until the projects have been processed and the indexes loaded. The initial Rider project-chooser takes longer to start up than you’d expect. Once it’s up, though, opening a solution from there is very fast. Rider runs all open solutions in a single process. Visual Studio launches a separate process per solution.
While I’m happy that the startup speed has improved all-around, I don’t really care about startup speed, not really. I never reboot unless I have to. I never log out unless I reboot. I just leave my tools running all the time. I have 32GB of RAM. Once it’s running, it’s running, and I don’t care how much RAM it takes (within reason)—I care how fast it does the things I ask of it.
Once I configured StyleCop.Analyzers, my initial solution-load in Rider showed a shocking amount of memory for Quino (an extra 4.5GB just for the Roslyn checker process). It felt fast enough, even though the memory usage kept growing. Rider’s a 64-bit process and I have 32GB of RAM on my desktop, so it was a luxury I could afford.
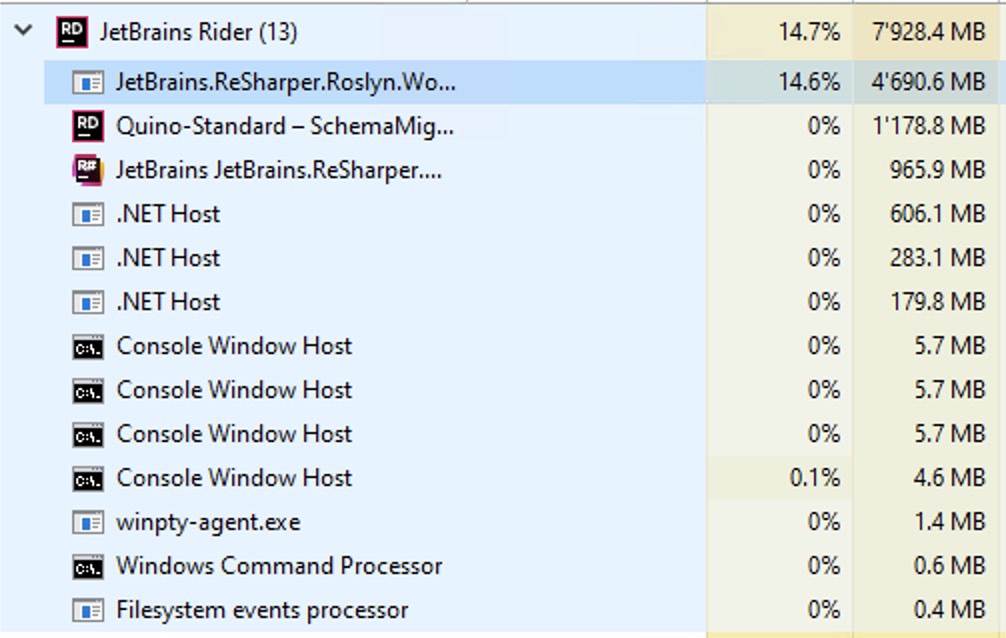
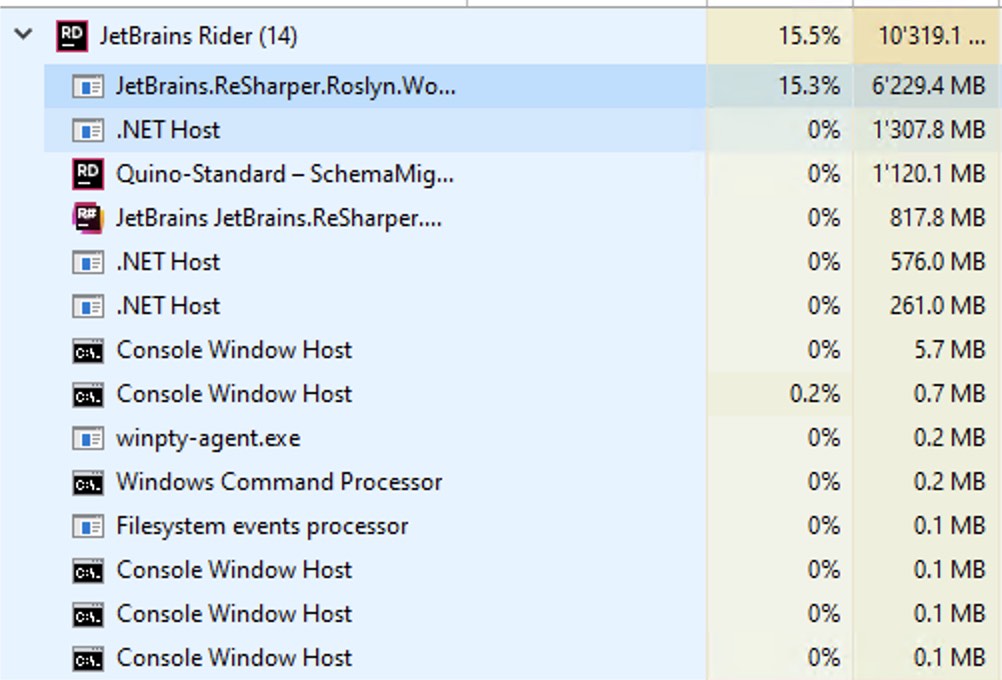
Luckily, after a restart, the memory was still higher than it was, but now stable at around 3GB.
Conclusion: No real launch-speed advantage until a solution is navigable. Both use about a reasonable amount of RAM.
Performance Issues and Crashes
Solution-wide analysis is enabled by default in Rider, with no performance degradation noticeable at all. In fairness, there is little to no performance degradation evident with ReSharper in Visual Studio either.
Code Vision is enabled by default in Rider; also no performance-degradation noticeable. I am running everything on a desktop and I have seen CPU usage spike quite high on Rider. Code Lens in Visual Studio and Code Vision in Rider both probably suck the life out of a battery, though. TANSTAFL.
While it’s nice that Rider uses all available CPU power for certain tasks—e.g. building—I imagine that the CPU fan would be running a lot under heavy usage. Visual Studio probably suffers the same, though its CPU usage seemed to be flatter when I checked.
Solution-reloading is more stable and a bit faster than in Visual Studio. In a recent task where I was constantly cherry-picking and rebasing, making changes to project files and the solution file, Rider just worked. Visual Studio would usually throw up a yellow warning bar at the top sooner or later (usually sooner).
Sometimes, Rider is quite slow at getting its “intention actions”, something I’ve never seen with ReSharper.
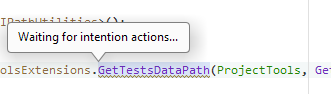
This usually clears up after 5-10 seconds, but a couple of times, Rider went looking for inspections for 10 seconds and came up with nothing—repeatedly. It’s odd because, in that case, Rider kept having trouble with the same extension-method call and had to look it up again and again. This effect is noticeable in other places, as well. When you elect to show the dialog to “Configure Inspection Severity”, then sometimes it takes several seconds to show the dialog box (with no user feedback).
And, sometimes, Rider just dies. For example, when I look up sources for a .NET type, like IndentedTextWriter, by using ⌥ + F12. Rider showed a dialog for several seconds, but didn’t seem to be doing anything. It wasn’t downloading, as expected; instead, it just showed “Searching for implementations…”.
This wouldn’t be worth mentioning but, after having dismissed the dialog, now I can’t navigate to anything with F12. I have to restart Rider. This is not the first time that this has happened. This never happened with Visual Studio. It definitely makes the IDE feel much shakier.
In Visual Studio, with R#, I can view the sources for IndentedTextWriter after only a slight pause.
On the subject of reloading: Visual Studio definitely still freezes more (usually showing its yellow warning bar at the top after a few seconds), but Rider is just more subtle about being loaded, but still unusable. You have to keep an eye on the progress bar at the bottom in both IDEs. In general, Rider reloads more quickly than Visual Studio—and has no UI “hangs”, like VS still does, for a few seconds—but not always.
On the other, other hand, I’ve also experienced more build errors after changing framework targets than with Visual Studio. Rider can’t copy files or its looking in the wrong place for files. Restarting Rider fixed that problem, but I shouldn’t have to restart to fix a build. Rebuild should have fixed it, but it didn’t.
Conclusion: The latest version of Visual Studio with ReSharper feels more stable than Rider and has fewer mysterious failures. Rider reloads more quickly.
Code Analyzers and Quick Fixes
I was unable to get Rider to respect the generated_code setting from the .EditorConfig file, something that worked immediately with Visual Studio/Roslyn (ReSharper is not involved). I’ve reported that issue as RIDER-61283. In the meantime, I’m using the “Elements to Skip” feature to ignore the same file masks Rider should be ignoring anyway. That at least works for now.
Still, Rider’s integration is nice because it pulls everything together into a single list, but its quick-fixes for Analyzer inspections aren’t as strong as Visual Studio’s nor can you actually fix everything (see the issue with UTF8 below).
In Visual Studio, the analyzers work quite well, but there is no integration with ReSharper. Instead, the integration with Visual Studio is really good—with Ctrl + . instead of ⌥ + ⏎, you can get quick fixes and even apply them to the entire method, document, project, or solution.
In Visual Studio, there’s a very nice preview mode. In fact, there is useful and accurate user feedback throughout, which was a pleasant surprise. It’s quite fast in collecting fixes for all 120 projects and applying the changes. There’s even good keyboard support for arrowing to the file/project/solution actions. This is a definite boon for getting through thousands of fixes quickly.
In Rider, there are quick fixes, but most of them only work for a single instance of the inspection. Some of the fixes (e.g. each attribute on its own line) can be applied to file/project/solution with ReSharper as well, but not all. Some of the fixes aren’t available at all with ReSharper (e.g. SA1513, insert newline after brace) but are available in Rider.
So, Visual Studio’s integration with Code Analyzers worked better out of the box, but it forces you to use both ReSharper quick fixes (⌥ + ⏎) and VS quick fixes (⌘ + .), depending on which system detected the issue. The inspections also show up in two different panes. This is actually easier to get used to than it sounds, though.
Conclusion: Rider has a merged view, which is nice. Visual Studio has quick fixes for everything, applicable to method, document, project, and solution.
Inspections
There is no ReCommended extension for Rider (with no plans to add support, according to issue #51: Add support for Rider 2020.2, which was closed as “too much work”. All of these inspections are missing in Rider.
- Check usage of annotations
- Check
async/awaitusage - Check usage of lock variables
- Etc.
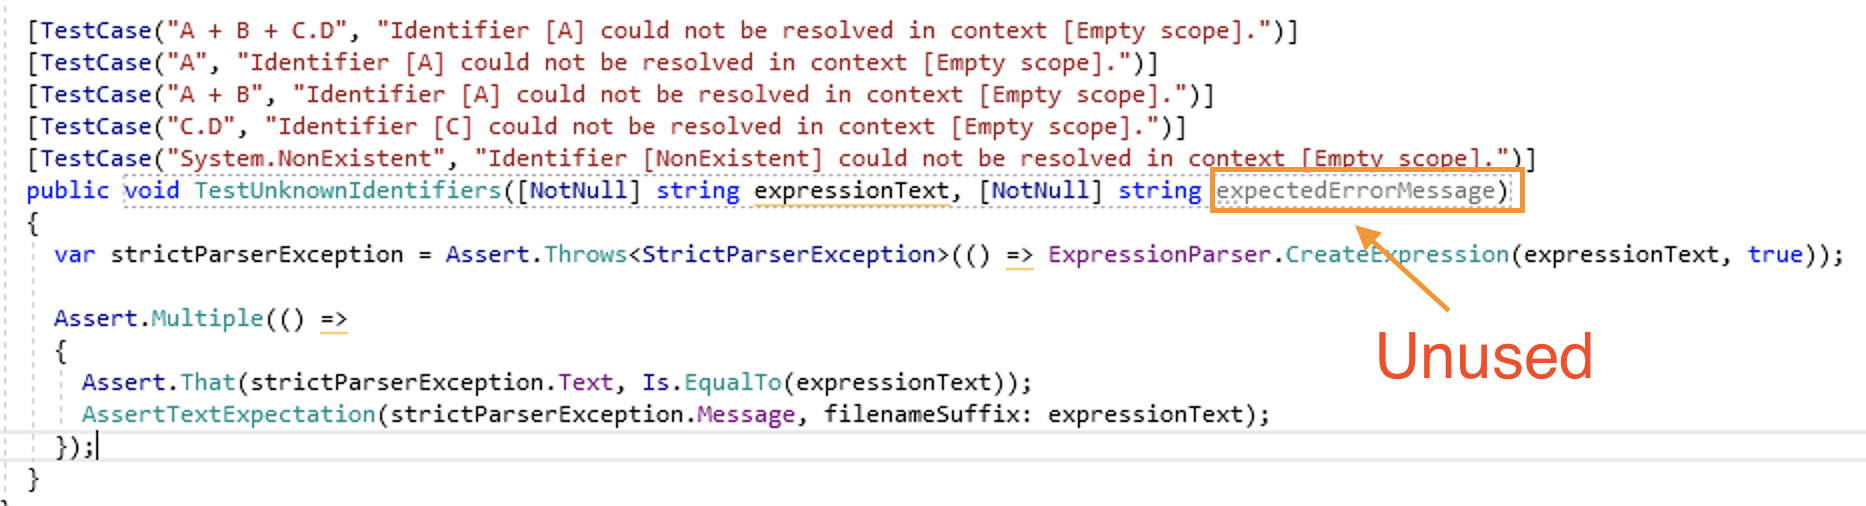
When you add a parameter to the constructor, Rider doesn’t mark the identifier as unused if it has an attribute. In the examples below, you can see that the identifier is grayed out in Visual Studio, but not in Rider.
 Unused parameter in Visual Studio
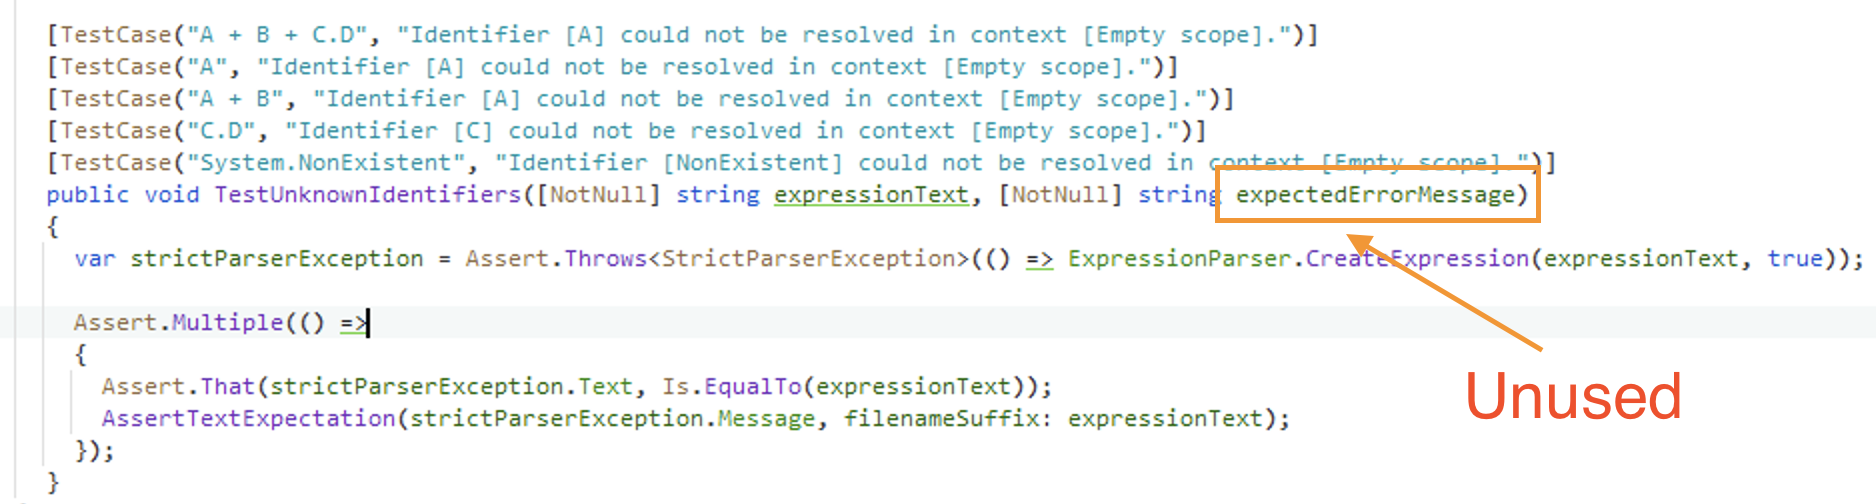 Unused parameter in Rider
Sometimes Rider doesn’t indicate when a conditional access is unnecessary (e.g. when ?. can be converted to .). It also doesn’t indicate when an expression that is always false or true could be simplified as reliably as ReSharper does.
Neither Rider nor ReSharper seems to notice when you do a silly pattern-matching check, like if (sender is Person person) when person is already a Person. VS, Rider, and ReSharper simply assume that you’re doing the check in order to assign the variable, I guess.
Conclusion: Both have a tremendous number of useful inspections, but Visual Studio/ReSharper/ReCommended is a slightly more powerful combination.
Inspection Accuracy & Speed
Now I know why the solution-wide analysis is so fast in Rider: It doesn’t reevaluate warnings when the project changes (e.g. if you change the root namespace). You have to visit each file individually for it to clear the warning. Clicking “Reanalyze all files with errors” doesn’t work on files with warnings, as it does under ReSharper.
You can use ⌥ + ⇧ + PgDn to jump through the warnings, opening each file as you go. It’s pretty fast, but feels clunky. This is especially unfortunate when Rider thinks that there are errors. I suppose that this is a side-effect of repeated solution/project reloads as I’m quickly switching branches.
Changes to the ruleset and stylecop settings are noticed in both IDEs instantly. I changed a rule from warning to info and Rider changed the color of the squiggle in what felt like less than a second. Unfortunately, changes to the .stylecop.json file are not picked up without a reload of the solution.
Here is where ReSharper is much perceivably faster than Visual Studio. It’s even a bit faster than Rider. Turn on solution-wide analysis. Remove the last reference to a function. Watch ReSharper gray out the identifier in the declaration nearly immediately. Or remove a method call. Watch ReSharper underline it immediately. Visual Studio/Roslyn? Still feels laggy.
ReSharper’s list of errors and warning updates immediately. Rider’s is pretty good, too, but, mysteriously, not as accurate or quick-to-update as ReSharper’s. Both are much faster than Visual Studio/Roslyn, which often takes long seconds to clear warnings or errors—and sometimes never does, until you force a build.
Roslyn (Visual Studio) is sometimes flaky and won’t clear old warnings/errors until the next build. ReSharper was definitely faster here, even with the extra StyleCop parser. This didn’t used to be an issue, but with the switch to Code Analyzers, I’m now using Visual Studio/Roslyn for a good portion of my inspections (StyleCop).
What does flaky mean? Whereas Rider updates relatively reliably when you make a change in any file, StyleCop Code Analyzers in Visual Studio will only occasionally show the warnings. If the file isn’t open (or in some sort of in-memory cache), then only a “Rebuild All” will make the warning appear. This also only works if you’re not using “ReSharper Build”.
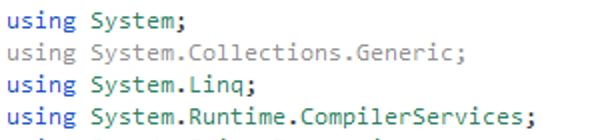
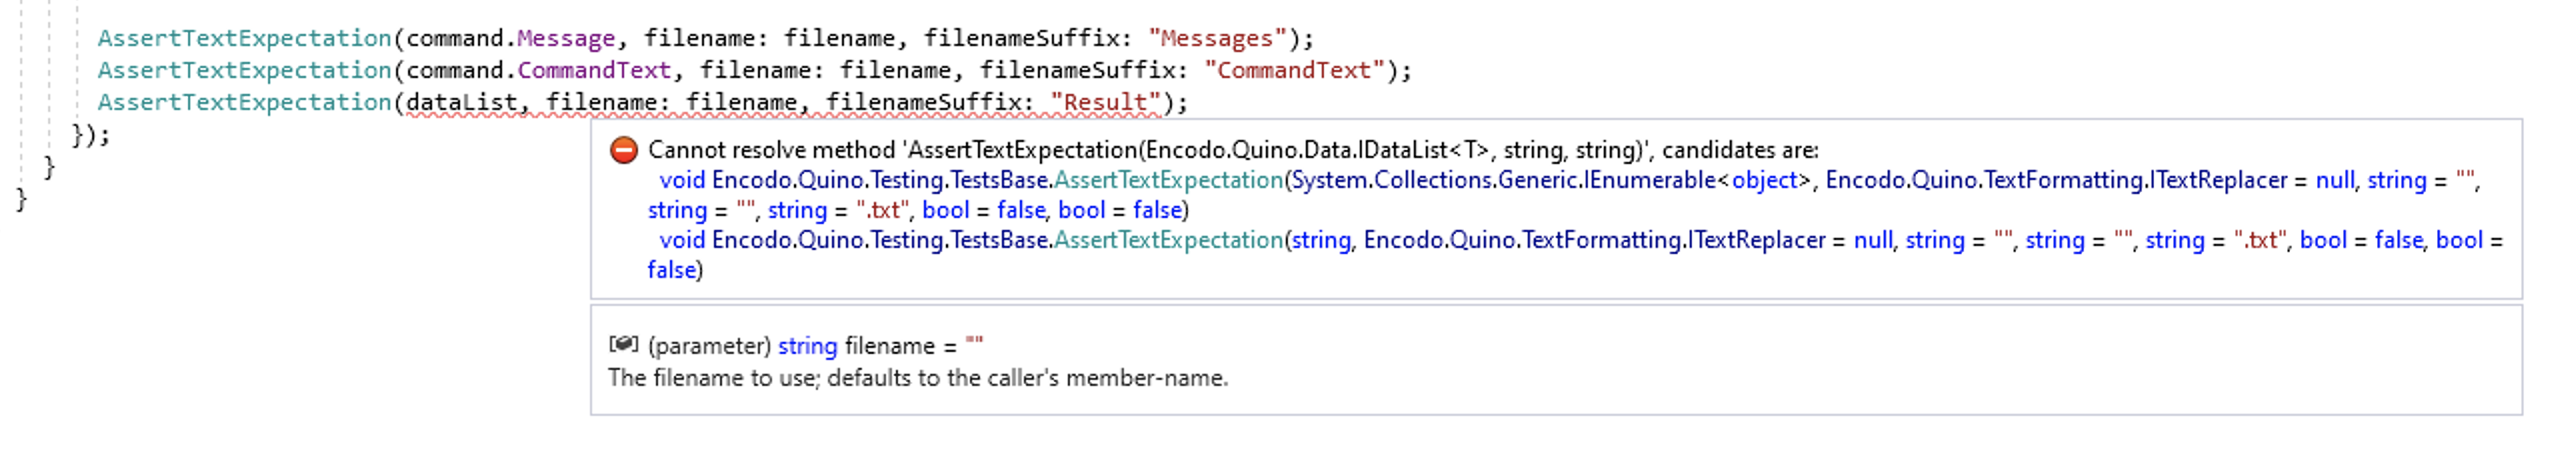
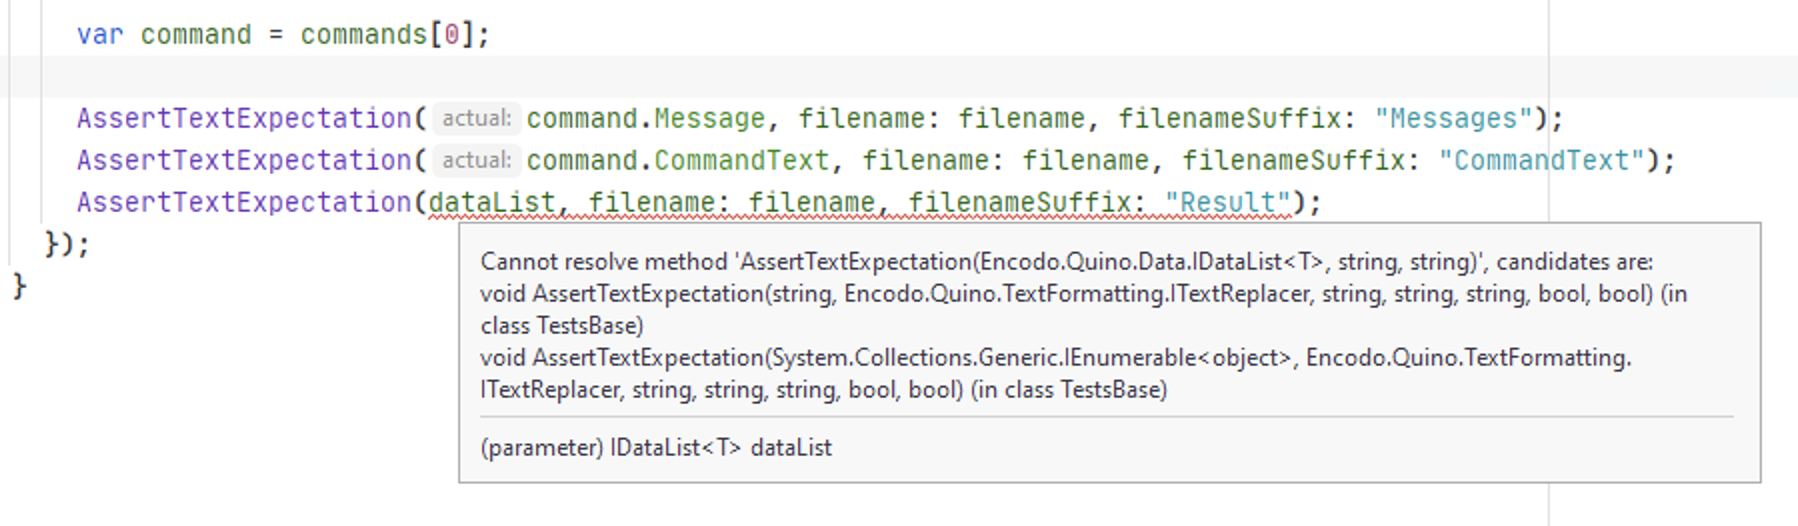
Rider does this much less often, but it still does occasionally have incorrect inspections that can be very difficult to correct. For example, the following screenshots show an unrecognized dictionary.
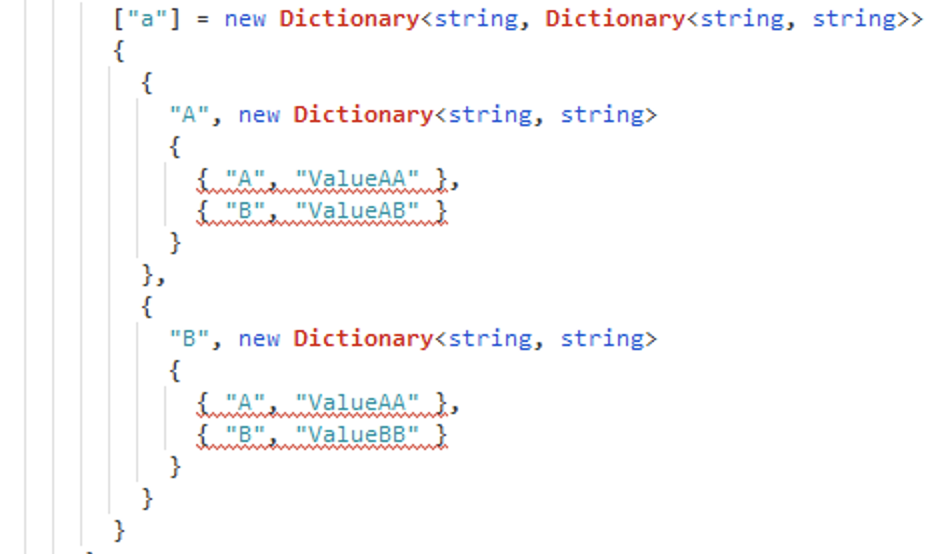
Visual Studio recognizes the using System.Collections.Generic, but Rider grays it out.
Restarting Rider sorted out this error. Several other cached errors and warnings disappeared with the one noted above.
Rider is very quick, as is ReSharper. Also, it’s generally pretty good on updating inspections, but I’ve also seen flakiness with lingering warnings and errors in the pane, but never in the sources. The only way I’ve found to update the pane is by actually opening the file, at which point Rider re-detects that the issues are gone and clears the inspections. Manually triggering a reanalysis does not help here.
Conclusion: Both have lingering inspections sometimes but, overall, Rider’s inspection speed and accuracy are both better. For either IDE, run “Rebuild All” to see all warnings.
Navigation
The solution-wide find/replace window in Rider is lightning-fast and supports newlines, copy/paste, regular expressions, shows change previews. It’s wonderful. The change previews in Visual Studio Code are just a tiny-bit better, but the overall experience is solid and super-fast. The search/replace in Visual Studio is looks very dated next to this feature in Rider.
Navigation to other files is so fast in Rider that I sometimes thought it hadn’t navigated (it had!)
There is no way to navigate the warnings in a solution using the keyboard. In general, Rider tends to let panels “steal” the keys for next/previous, so when you try to navigate errors or warnings or find-results, the test session can “steal” these keys and suddenly you’re navigating tests and fixtures instead. I find myself grabbing the mouse more often in Rider than I do in Visual Studio.
Where ReSharper has Ctrl + T as a central search for everything, the same key combination does not include “search everything” in Rider. For that, you need to switch to Ctrl + ⇧ + F. On the other hand, the dedicated “find in solution” panel is lightning fast and makes up having to switch between panes.
Conclusion: Both offer really good navigation, but I give a slight edge to Visual Studio/ReSharper for consistent keyboard support.
Editing
Column/Noncontiguous Selection
Rider doesn’t really support extending a non-contiguous selection. It has column-selection mode, like Visual Studio, but it doesn’t have ⌘ + Shift + . to select “like” text. In Sublime Text and Visual Studio Code, this feature is available via ⌘ + D. Rider doesn’t seem to have this, which limits editing capabilities. There is documentation for multi-selection but the shortcut keys are confusing and not the ones I have assigned. Nor can I find anything in the keymap with any of those names. It’s either a new feature or its only partially supported.
Update 23.04.2021: I just tried ⌘ + Shift + . in Rider (even though that wasn’t documented) and it works just like in Visual Studio! That’s a nice surprise. I’m not sure if this was always there and just poorly documented or whether they just added it in a recent release. At any rate, good news for editing in Rider.
Commenting
Pressing Ctrl+K/Ctrl+C comments code. However, instead of commenting again, it uncomments if applied a second time. This means I can’t “double comment” to indicate that this code is temporarily preserved, but should not be flagged as commented code to be removed.
Double-click Select
Double-clicking on an identifier uses CamelHumps, if you have CamelHumps enabled (just like all other JetBrains tools). With ReSharper, though, the CamelHumps apply to cursor-based word-selection, but a double-click selects the whole word. I think that’s a better balance because that’s what I expect when I double-click an identifier. I don’t think I’ve ever wanted to select just a part of the double-clicked word by default. It’s not a deal-breaker, but it’s annoying because I have to double-click, then extend the selection manually to get the full identifier.
Undo Buffers
The undo function in Rider fails much more often than I’m used to from Visual Studio. I’ve deleted lines of documentation and then hit undo and Rider couldn’t get them back.
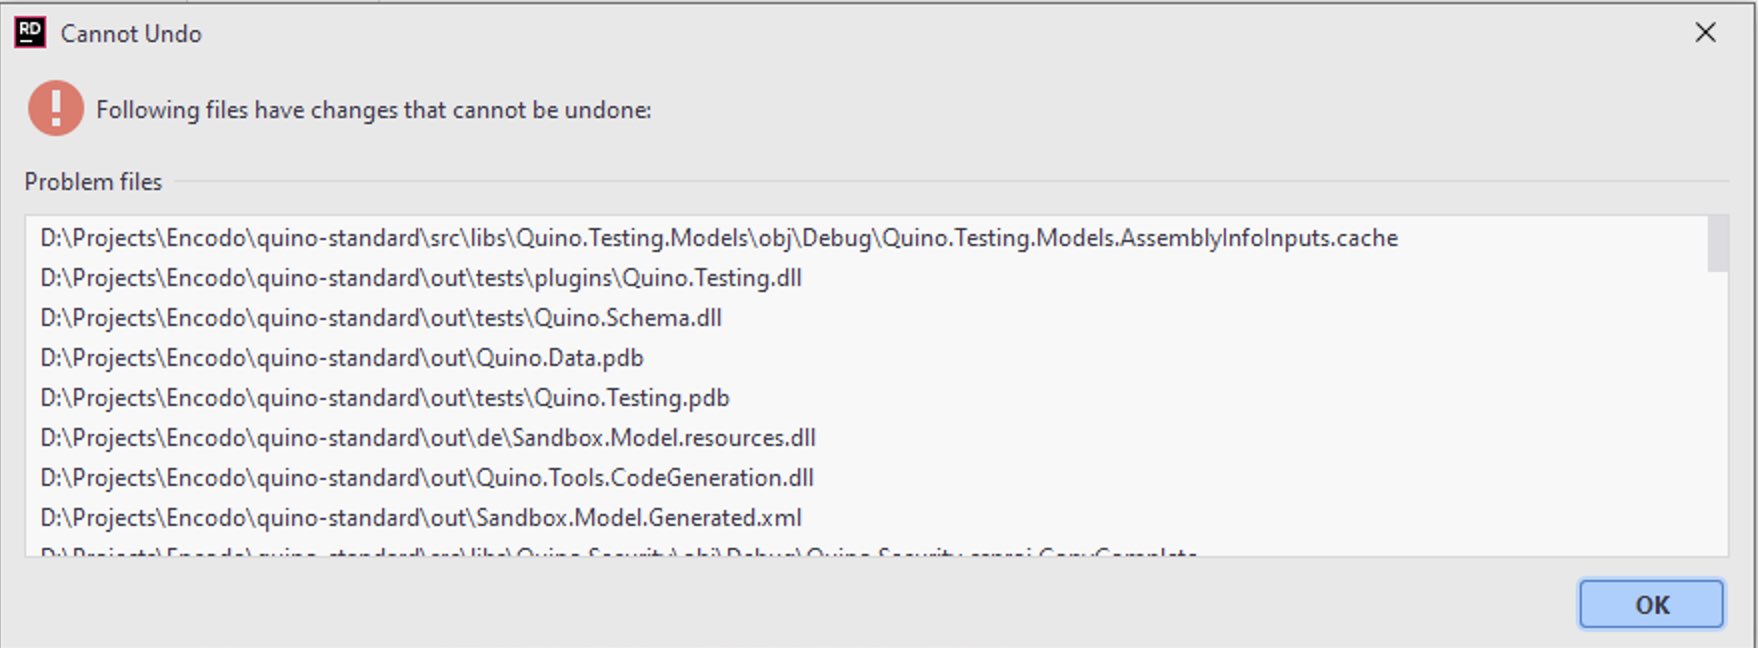
Once the undo buffer is broken, you have to restart Rider in order to be able to undo again. It feels quite unstable. I’m quite surprised, considering the literally dozens of popular IDEs built on this platform.
UTF-8 Support
Rider creates files as UTF-8, but without the BOM. Then the StyleCop analyzer demands that the file have a BOM, but there is no quick fix in Rider for this, nor is it clear how to convert the file. I end up switching back to Visual Studio, where there’s a quick fix to set the encoding properly.
Typing Speed
Typing speed is better in Rider than in Visual Studio/ReSharper. Just a little, but it is. It’s smoother. Even after replacing the StyleCop extension with StyleCop.Analyzers, it still feels a bit smoother, overall. Rider on Mac feels even smoother than Windows.
Conclusion: Rider’s text-editing is smoother but Visual Studio feels slightly more solid overall.
Code Completion
I just wasted 10 minutes in Visual Studio trying to figure out from the documentation how to create a StreamWriter with a non-default encoding. The list of overloads did not show any overloads when using a path.
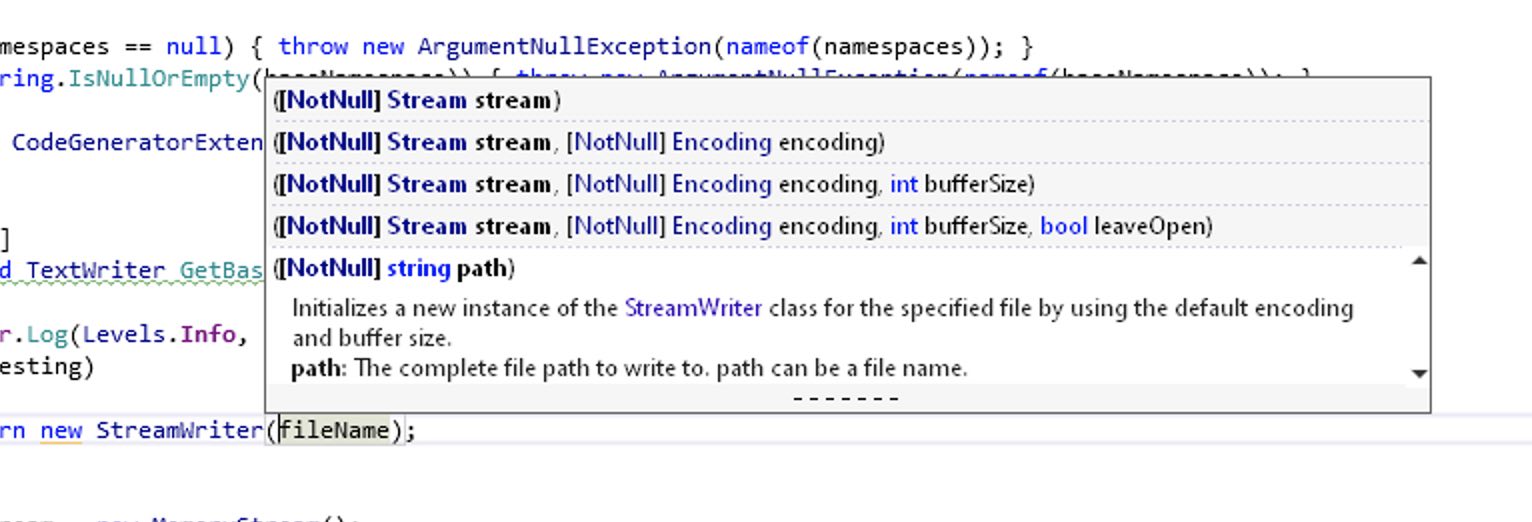 StreamWriter constructor overloads in Visual Studio
I searched and the wizards at StackOverflow rather snippily asked why not use the docs? So I looked at the docs and then switched to the right target (first .NET 2.1, then .NET Standard 2.0), but the desired overloads have been around forever. Back to VS and it is really not showing those overloads. Switch to Rider and … there they are.
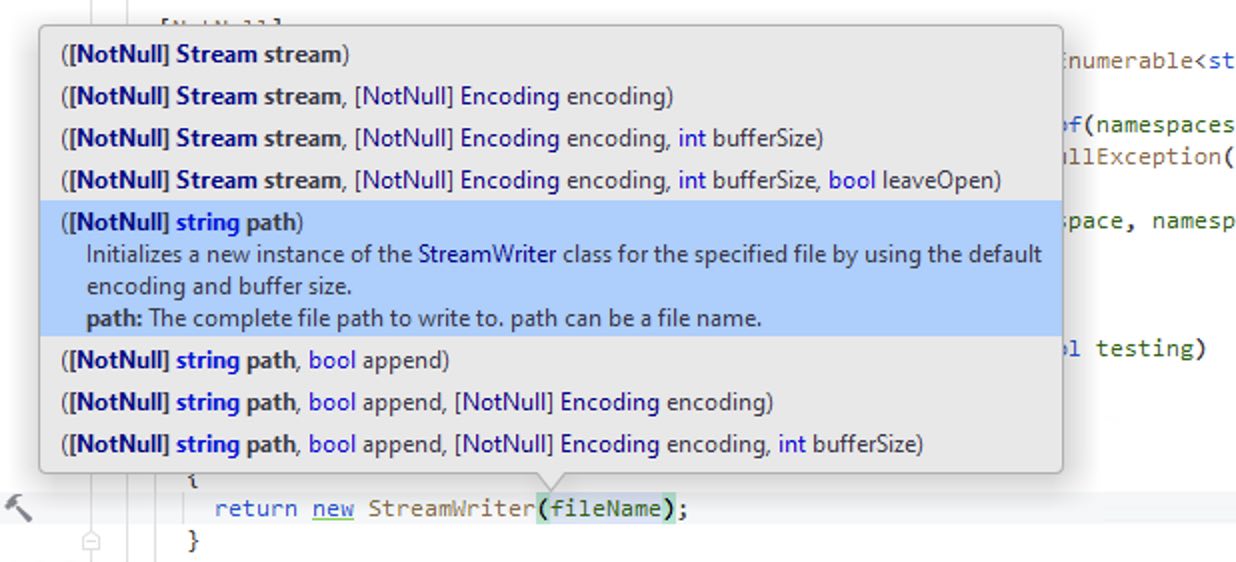 StreamWriter constructor overloads in Rider
It turns out that Visual Studio has a maximum height for its overloads list. The only hint that there are more methods are some heretofore not-noticed dashes at the bottom. The only way to see the other overloads is to select the popup and use the arrow keys. There is no scroll bar or other evidence to indicate that this is possible. There is also no reason why the popup couldn’t be taller.
In Visual Studio, the developer can use the up arrow and down arrow to traverse the various overloads, showing the documentation for them. In Rider, it’s not obvious how to navigate. The trick is to keep hitting ⌘ + ⇧ + space to cycle forward through the list.
Typing a { in a non-interpolated string does not show code-completion. In ReSharper, you can type {, select a variable and ReSharper automatically makes the string interpolated. If you add a parameter, Rider rightly complains that the data between the curly braces needs to be an index, but doesn’t offer to convert the string to interpolated. You have to go back to the front of the string and add the $ yourself. This is now working in Rider 2020.3
Conclusion: Visual Studio’s UI is more easily navigable, but Rider’s UI is better for longer lists of overloads.
Refactoring
Rider doesn’t offer to rename related symbols as much as ReSharper does. For example, if you rename a field, ReSharper will offer to rename the constructor parameter that sets that field. Rider does not.
When you insert a new parameter in a method call and then tell Rider to add it to the method, it then shows a panel with other calls that need to be updated, asking how to handle each one. This is the same as in ReSharper and is a welcome feature. As in ReSharper, you can navigate the various calls with the arrow keys and the focus is set correctly. However, I can’t figure out how to activate the choices with the keyboard. I have to use the mouse.
Conclusion: Both amazing, but slight edge to Visual Studio for completeness.
Restore & Build
The NuGet integration is nice in Rider and the NuGet Explorer is quite fast. It still doesn’t feel as robust as Visual Studio, but it’s getting there. I rarely went back to Visual Studio to try to resolve an issue I couldn’t solve in the Rider UI.
Rider’s “build” command still doesn’t notice when you’re changed packages external to the solution and do a nuget restore for you. In fact, when I updated Winform DevEx packages externally (because neither the NuGet UI in Rider nor that in VS could apply the changes without getting tripped up in dependencies because it can’t upgrade multiple projects at once), Rider had no idea what I’d done until I manually deleted the obj folders from the projects that depend on DevEx.
I don’t recall having to do that for Visual Studio, which runs a nuget restore check before each build. Visual Studio was more amenable to finding the actual error with a “rebuild all”. Rider cached more and stayed stuck on the original “error”, which was hiding the real problem (an interface mismatch after the upgrade).
When you update NuGet packages, Rider uses stale data a lot more than Visual Studio does now. This is how Visual Studio used to be, but it’s gotten a lot better with its caches. Rider is still a few steps behind. I just upgraded NuGet packages for a project and then ran the tests. A bunch of them failed with a MissingMethodException.
I know this error, so I forced a full rebuild and ran the tests again. This time everything worked. With Visual Studio, I’d gotten used to no longer having to consider “rebuild all” or “restart the IDE” as possible solutions. With Rider, you still have to occasionally use these solutions, for now.
It’s not the end of the world, but it does waste time and effort—especially if you don’t jump to that conclusion quickly enough. Often enough, you’ll lose a good quarter of an hour chasing phantom errors and warnings instead.
Conclusion: They’re both about the same for day-to-day use, but Visual Studio is still slightly better at corner cases.
Testing
When you edit a unit test to change the parameters to a test case, the test session will update and then move the selection to the top of the list. This is very annoying since it always scrolls away from the test area I had focused. It also has an annoying habit of nearly constantly changing the selected item in the tree, making navigation difficult.
This might be related to when tests are running or a build is running, but there’s always something like that going on—it’s not very nice that the whole IDE has to be quiet before I can use keyboard navigation in a tree without Rider constantly stealing focus and jumping around.
While running tests, Rider does not allow you to collapse nodes in the unit-test session. It quite annoyingly expands it again whenever you try to collapse a node.
Searching in tests is quite slow in both Rider and ReSharper.
Update 23.04.2021: I’ve discovered that I can use F4 in Rider to jump to the source of a test. That’s very handy because double-clicking on a test in either test runner has unpredictable results that seem to depend on whether the test is defined in a base class.
I can’t treat the Unit Test Session window as an editor window in Rider, so it’s harder to switch back and forth. The tests are docked at the bottom by default. You have to switch to that window with a hotkey, then use another hotkey to hide it. I’m getting used to it, but I don’t understand why the JetBrains IDE doesn’t support this feature (it doesn’t have it in any other JetBrains IDEs I’ve used either).
Conclusion: There’s not much difference in testing support between the two.
Debugging
Integrated debugging with auto-disassemble and sources in Rider is pretty awesome (e.g. I debugged into SimpleInjector without SourceLink). You can open any referenced type in any assembly and either have the original source from SourceLink[4] or disassembly. In either case, you can set breakpoints and debug into it. If the file is disassembled, it’s not always pretty, but it’s amazingly useful for inspection.
The Smart Step-in feature in Rider is a very nice upgrade, to which I’ve already become quite accustomed (just ⇥ to cycle locations). It’s a bit finer-grained than being able to disable property step-in universally in Visual Studio.
On the other hand, I’m not super-happy with the different ways of running an application in Rider. They seem to make it very difficult to debug an application and stop on unexpected errors. I’ve seen other users using Rider just kind of look in the output window as if live debugging wasn’t a feature we should all expect to work. It can be configured, but you have to make sure to run in debug mode and turn on exception-handling.
It’s also much harder to debug a StackOverflowException in tests because Rider doesn’t show a useful stack trace (it instead shows a trace for the LogException in the test runner itself. The “launch log file” is detailed, but provides no additional information. Instead, I was forced to set breakpoints and continually “edge closer” to the crash and find it myself. This is how Visual Studio used to work, but for a couple of years, its handling for stack overflows has been much better.
Also, Rider doesn’t stop on unhandled exceptions by default, either when running tests or running a web server. The stack trace in the debug output when running the web server isn’t highlighted and can’t be clicked.
The debugger in Rider does not make use of the DebuggerTypeProxy to display or format debugging information, which is a shame because Quino has useful customizations for debugger display that I miss in Rider.
Invalid Targets
I was unable to debug unit tests for a while because Rider complained that my DotNet runtime (AnyCPU) didn’t match the chosen testing target (x86). All of the solutions I’ve opened have been “Any CPU”-only, so I was mystified how Rider came up with the idea to run my tests as x86.
Rider pops up a helpful tip to take me directly to the setting to change the runtime to use. I don’t even have an x86 runtime. And I don’t want to run tests as x86 anyway.
The real fix is to go to Settings => Build, Execution, Deployment => Unit Testing => Default platform architecture and set it to “Automatic”. Mine was hard-coded to x86, for some reason (maybe a settings upgrade from an older version).
Variable Inspection
Viewing a variable isn’t as easy because Rider uses a much less-stable tooltip than VS. If you have a long value that you want to “view”, you have to cruise your mouse along a long, skinny tooltip for dozens of centimeters before you can click the “view” button (you have to know it’s there) at the end.

Since the tooltip is unstable, Rider has trained me to go down to the variable window and copy the value from there.
Conclusion: Both debuggers are excellent—each has advantages and disadvantages—but Visual Studio still has a slight edge. It feels more mature.
External Sources
Both Rider and VS/ReSharper support navigation using SourceLink as of 2020.3, which is a massive win for usability. Now you can open a type with Ctrl + T or hit F12, ⌥ + Home, ⌥ + End to navigate to a related symbol from source and Rider/ReSharper will navigate within the SourceLink sources, which means that you can easily set breakpoints in code from NuGet packages, as long as they have SourceLink. Rider additionally offers support for setting breakpoints in disassembled code, with mixed results.
However, browsing works less well in Rider. For example, I pressed ⌥ + F12 on EventHandler to “peek” it and it popped up a processing dialog for 15 seconds before I canceled it. When I pressed F12 to navigate there instead, it didn’t show a progress dialog, but it also just seemed to break Rider because syntax-highlighting and code-completion stopped working for subsequently typed code. The “Errors in Solution” pane was similarly crippled, showing files with warnings, but no warnings. The navigation action never showed the code for the EventHandler, but it did make everything else stop working. A restart fixed everything.
In addition, navigation to authenticated sources was only working temporarily. It is broken in the most recent version of Rider, as I’ve documented in RIDER-61280.
Conclusion: Visual Studio is more reliable with SourceLink right now. Rider can debug and set breakpoints in disassembled sources (which it has to use because SourceLink is broken again).
Documentation
The formatting for XML documentation works strangely when Rider inserts text in documentation (e.g. when you apply a fix). We use a tab size of 2 everywhere, but the settings window shows a tab size of 4, but also mention that some settings might be overridden by the .EditorConfig. Reformatting or cleaning up code fixes the indentation to where it should be. It’s unclear where Rider is getting its settings for the initial insertion.
Even with the StyleCop Analyzers, there are fewer fixes for XML documentation than with Visual Studio/ReSharper. For example, there is no way to quickly add parameter documentation. Rider does not have any significant support for generating documentation (the initial format is very compact and never formatted according to rules).
Rider’s parameter-completion in documentation works more smoothly (Esc not necessary), but it does not use a “smart” sorting for tags. In ReSharper, once I’ve selected paramref once, that is sorted at the top and selected by default. In Rider, the order is unchanged, so I have to arrow down or type out most of the tag name in order to get past param.
Rider still shows a hint to add <inheritdoc/> on the class, even if the class has its own documentation.
Conclusion: Visual Studio’s XML documentation support is slightly better than Rider’s, but they’re both quite good.
General UI
Action Menu
There’s an extra item in the action list for “move to separate file” that does nothing. There’s another item that includes the name of the file in the caption that does work.
Tooltips
There’s no Enhanced Tooltip extension (and the tooltips are not as nicely formatted in Rider)
Icons
I can’t seem to change colors of icons as I can for ReSharper. I’d gotten used to brighter colors and miss them in Rider.
Inlays
In ReSharper, you can disable specific inlay hints directly from the completion menu. In Rider, you can do this for some of them, but not all. If it’s not there, you have to select “Configure inlay hints” and then have to find the corresponding checkbox yourself.
Windows Integration
Rider doesn’t keep track of the last opened solutions to open from the task list. [As of 2021.1.1, the task list is now populated with recent solutions.]
Git Integration
The “Commit” panel doesn’t refresh very quickly at all. Long after I’d seen the files in SmartGit, they were still not in the panel. When I switched away and then back, the new changes suddenly appeared. I don’t use the integrated Git support, but I’m not going to start, either, after seeing how it works.
File Structure
- The file structure panel does not highlight the element where the cursor is.
- The file structure panel does not support dragging and dropping
- The file structure panel does not refresh to reflect changes without closing it (or switching to another panel that hides it) and reopening/reshowing it
Key Maps
I can’t search for the bindings for a key combination in Rider, like I can in Visual Studio. Instead, I have to guess at the name of the operation that I think it’s bound to.
Update 23.04.2021: I’ve found that if you click on the magnifying glass to the right of the search field, you can “Find actions by shortcut”.
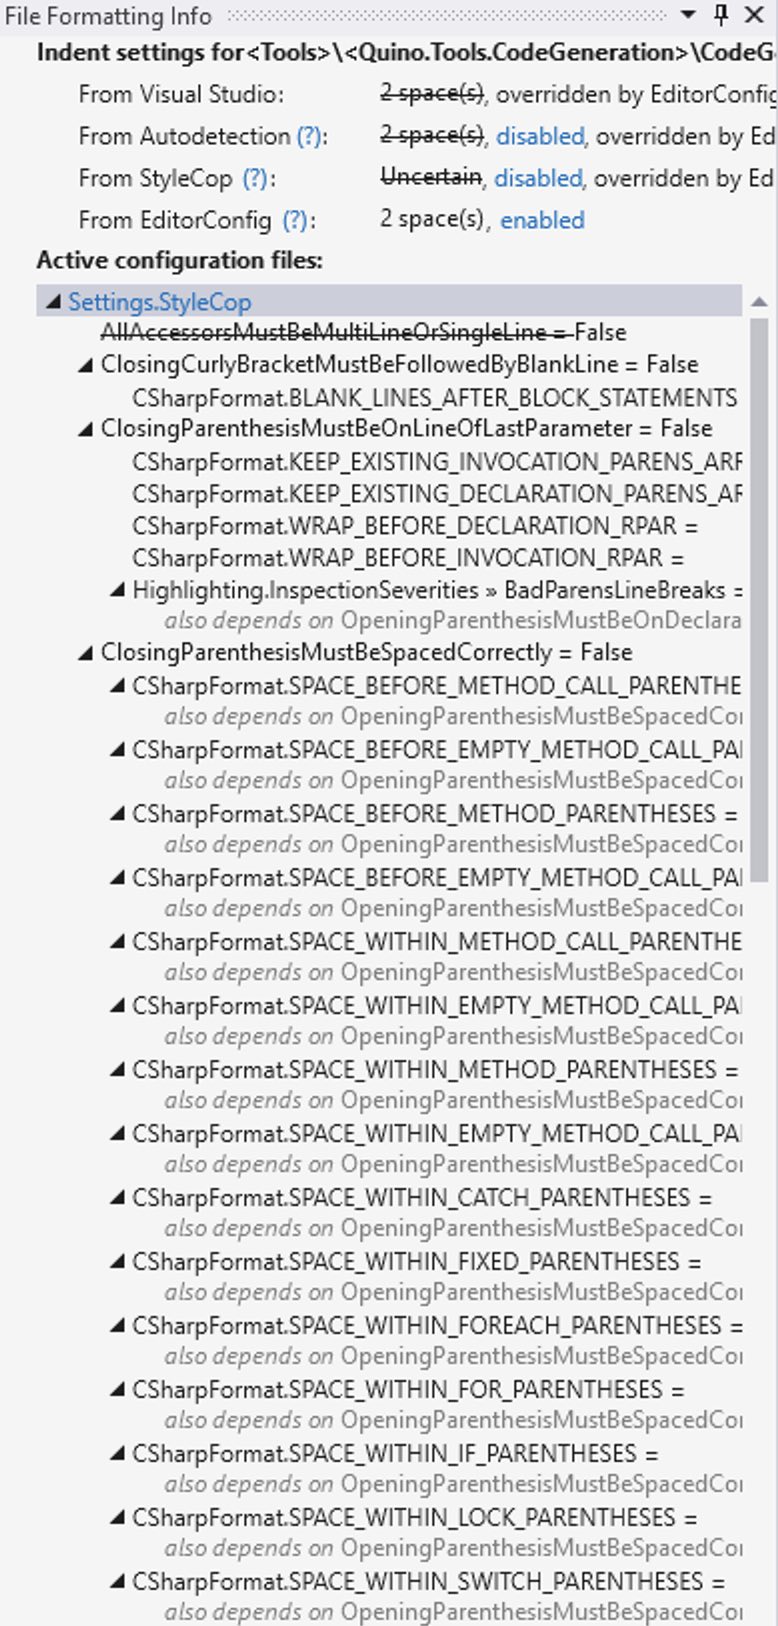
Fine-tuning Formatting
Rider also doesn’t have the “show active configurations” panel, for some reason. I’m currently fighting with Rider because it suddenly came up with the idea to format everything with 4 spaces instead of 2 spaces. Just yesterday this was finally working so that I could reformat the document and everything worked. Now, Rider is reindenting everything for me. Visual Studio/ReSharper is showing that I have 2 spaces configured.
Conclusion: Visual Studio w/ReSharper has a slight advantage in that it still feels more complete than Rider does.
Conclusion
Although Visual Studio/ReSharper edged out Rider in most of these categories, you’re well-served with either one. I think if I’d compared Visual Studio by itself to Rider, then Rider would have won easily. It’s only in combination with ReSharper that Visual Studio ends up being a bit better. It’s just more mature and I never found myself going to Rider from Visual Studio, whereas I did have to open Visual Studio a few times to fix something I couldn’t do in Rider.
It’s happening less with each version, though. Over the four months of the evaluation, Rider has improved steadily[5] I think you’re well-served with either version.
Once Rider files off a few more rough edges and has true feature-parity—perhaps by natively implementing some of the inspections from the ReCommended extension—it’s slightly smoother editor might help it pull ahead in this comparison.
Most of the above is complaining to a very standard, though. Both IDEs will make anyone who knows how to use them a much more efficient developer of reliable and readable code.
[1] I actually have an Enterprise license through Encodo’s Silver Partnership. However, when that license lapsed at one point (we forgot to take a test on time), I’d installed Community in order to keep working. A few days later, when my license was restored, I didn’t see the need to install Enterprise again. Almost two years later and I still haven’t done it. The Visual Studio installer doesn’t offer to “upgrade” the Community edition and I don’t have space for side-by-side installations. I could uninstall and re-install, but everything’s working now, and I miss nothing from Enterprise.↩
[2]
The last time I tried working with Visual Studio without ReSharper was over two years ago, with Visual Studio 2019 Preview 3. Still, I can see much more of Visual Studio working better than ever, taking over more and more of what I use ReSharper for.
I’d installed Visual Studio 2019 Preview 3 to investigate the following,
- Memory usage
- C# 8 features
- How does VS2019 work without ReSharper?
I installed the desktop and web-development workloads, totaling almost 6GB.
- Memory usage is better, obviously.
- I liked the default highlighting with purple for flow keywords (I actually ended up turning this on for ReSharper, as well)
- Finding references, ancestors and implementations is still tedious because Visual Studio does everything in panels or tool windows, rather than with popup menus
- Solution-wide analysis isn’t nearly the same
- Source-level highlighting of errors and warnings as I type are noticeably slower
- The test runner is much better than it used to be, but still not as good as the one in ReSharper/Rider.
- Ctrl + Q to quick-search features works just as well as Ctrl + Shift + A does to find “actions” in ReSharper.
In November of 2020, the article Announcing .NET 5.0 by Richard Lander (MS Blogs) wrote that,
“[…m]oving forward, the idea is that as when we add new features to .NET, we’re also adding corresponding analyzers and code fixers to help you use them correctly, right out of the gate.”
and
“With .NET 5, we have heavily improved our support for static code analysis. This includes an analyzer for platform-specific code and a better mechanism to deal with obsoletions. The .NET 5 SDK includes over 230 analyzers!”
The latest versions of VS also allow you to fine-tune the severity of any warnings directly from the UI/Solution Explorer. This is all a great leap forward for Visual Studio 2019, but ReSharper still improves the following features:
- Navigation is much faster
- Searching and introspection is more efficient and uses better UX than VS’s standard lists
There are more refactorings. Visual Studio doesn’t yet help with inlining variables and methods in as many places as ReSharper does. Also, there are subtle inspections and quick fixes, like the following two that are only available with ReSharper/Rider.
- The test runner is head and shoulders above that of VS
- I miss “Find Everywhere”. R#’s integration of “find in files” is so much faster than VS.
[3] Visual Studio’s search is available, but it’s weaker than ReSharper’s. Enough so that I don’t want to use it unless I have to. It’s good, don’t get me wrong. It’s just not as good as I know what I could have were I to install ReSharper.↩
[4] As noted in a few places above.↩