SourceLink and external sources
I published a very similar version of the following article in the DevOps Wiki at Uster Technologies AG. Since nearly all of that post is general knowledge that I would have been happy to find before I started my investigations, I’m sharing it here.
Overview
When we think about navigating or debugging our code, we usually focus on the code we’ve written ourselves—local sources in our file system. IDEs have classically focused on being able to debug and navigate this code.
More and more, though, we’re also interested in navigating and debugging our versioned and compiled dependencies:
- Internal NuGet packages
- External NuGet packages
- The Base Class Library (BCL)
Most of these are available as source code. We would ideally like to be able to navigate and debug that code just as easily as we can our own.
The following sections define file types and terminology, and then explain how these concepts apply to debugging and navigation for external sources. You can also just jump to the sections on producing or consuming packages (especially as relates to authentication for private sources).
Diagram
The following diagram provides an overview of the process of obtaining external packages, along with their symbols and source files. It looks quite complicated, but accommodates the flexibility required by various stakeholders.
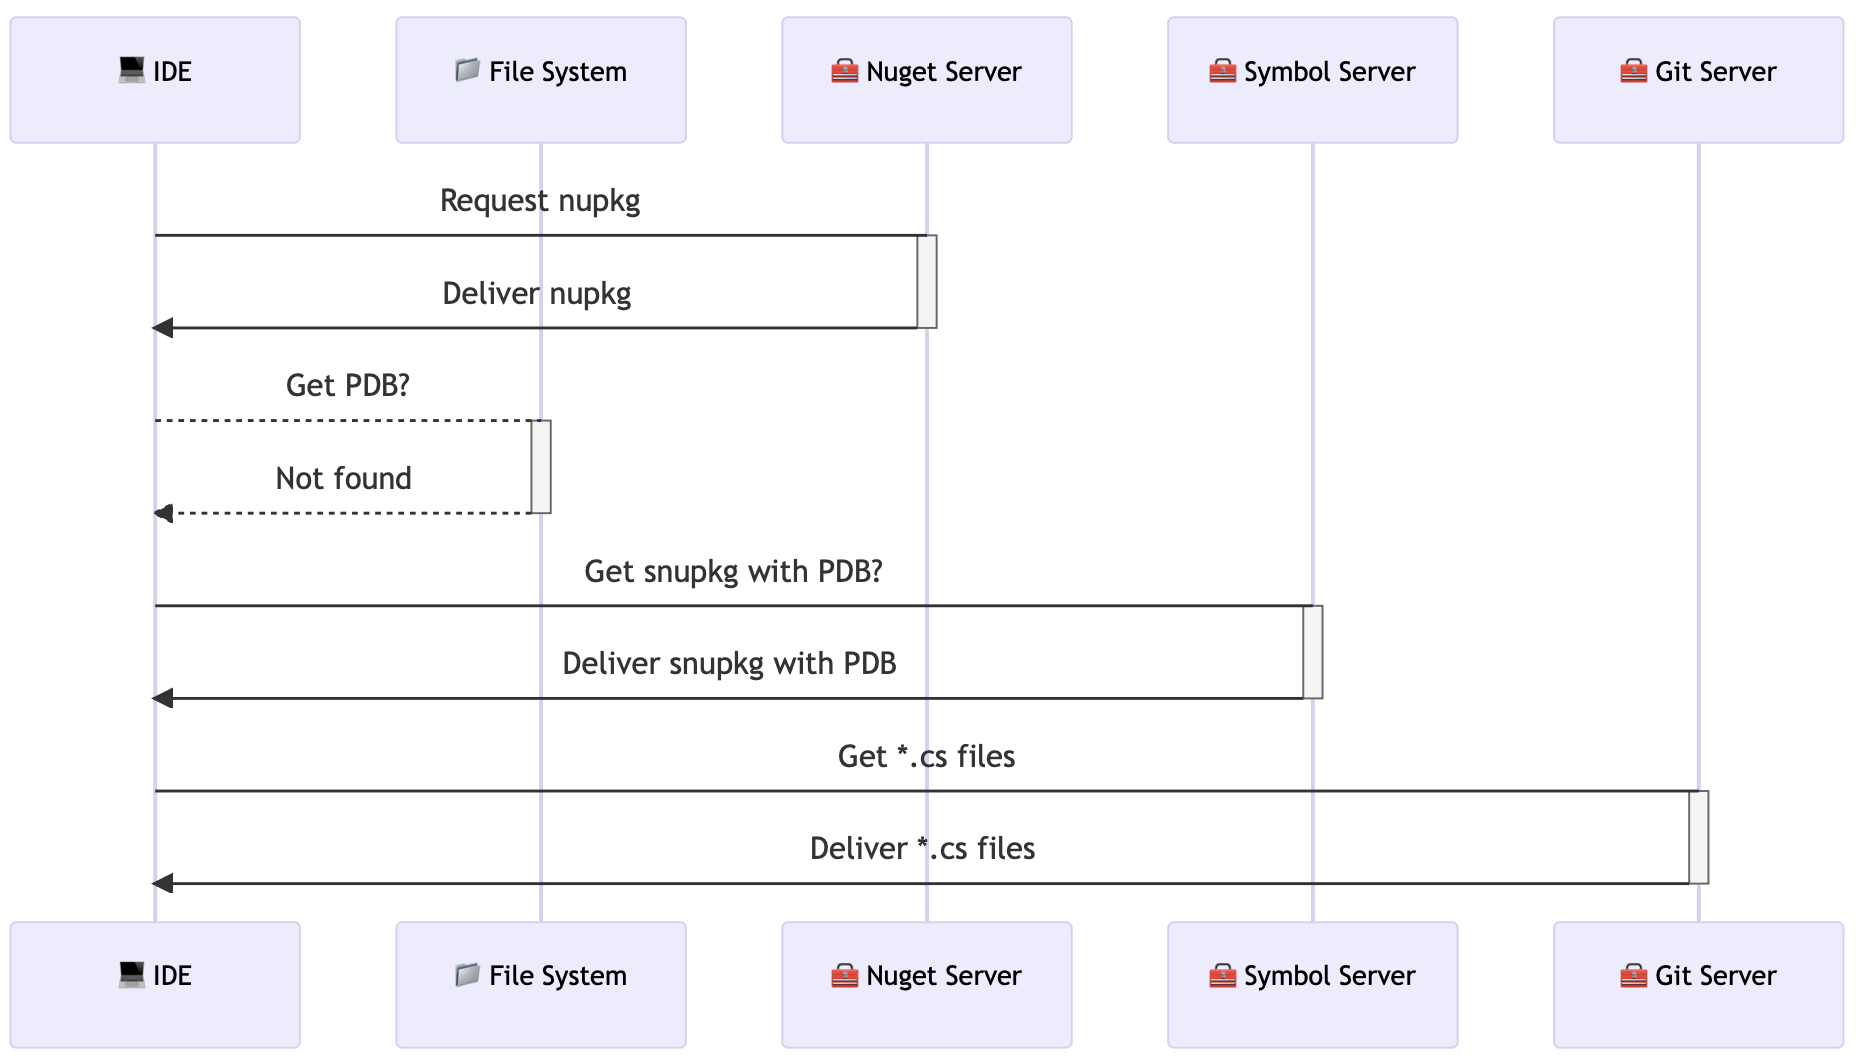 Symbol and source acquisition diagram
File types
There are several types of files associated with debugging and navigation:
DLL- The executable code generally only includes executable code (instructions). It can include debugging information, but this is relatively rare.
PDB- The “program database” contains the symbol information for the executable code, which allows the debugger to map instructions back to the source code.<br><br>This includes aliases (symbols), file positions, and any other necessary mappings, including references to source code files.<br><br>Although invented by Microsoft, the PDB is an industry-standard, platform-independent, and language-independent format. See, e.g., LLVM’s The PDB File Format documentation or the Wikipedia entry.
XML- The optionally generated XML documentation. Some IDEs can use this file to enhance the developer experience while browsing the source code.
*.cs- The original source code
Design Considerations
It’s reasonable to ask why this process is so complex.
Why can’t the nupkg just include the PDB and the *.cs files?
The system was designed for use cases where most sources were closed. That has changed, but the system still reflects the original design choices. The PDB files can also add about 30% to the size of the package. The original use cases preferred to avoid using 30% more space for package downloads that didn’t need the debugging information.
Why aren’t sources included in the PDB?
Again, historically, the use cases were for providing improved stack traces with symbols, but not to provide access to closed sources. Even if the sources are partially open, access may be restricted to only some users of the packages or symbols. Having the IDE request the sources separately allows an additional authorization phase.
What about open-source?
The defaults still reflect the original use cases, which actually represent fewer and fewer packages as time goes on.
These answers aren’t particularly satisfying if your use case happens to be “make a package that has symbols for excellent stack traces and sources for excellent debugging”. At least we now have IDEs that know how to work with this system and there is a lot of automation for producing packages with the desired symbol and source-code support.
Terminology
Debugging
A developer debugs source code by interrupting execution of a program—either manually or by setting breakpoints—and then stepping through the instructions, examining the contents of symbols (variables) to investigate the runtime behavior and operation of the system.
The debugger uses the PDB to allow source-level debugging, i.e. debugging in the original source code. While debugging in “lower” formats is possible, it’s not nearly as reliable as being able to step through the code in the original source code, using the original symbols.
How does the debugger obtain the PDB for a given DLL?
- First it searches in the same directory. This is by far the most common location where symbols will be found.
- Next, it searches on all known “symbol servers” in the order that they’re declared. All
DLLsandPDBshave unique identifiers that make it possible to request and download the correct file.
Once the debugger has the PDB, it has everything it needs—except the source code.
Local sources
If the PDB was generated locally, then it most likely references the source files that are still in the same locations in the file system as when it was built. In that case, the debugger easily finds the source files because they’re just at the paths that are directly referenced by the PDB.
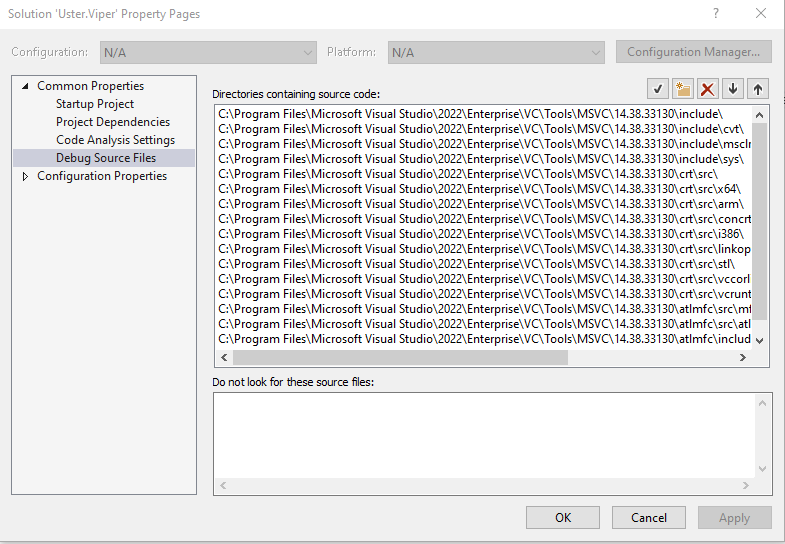
If the PDB was not generated locally or the source-code paths do not match, then there are other tricks to find the source files. Visual Studio allows you to set “Directories containing source code” for the “Debug Source Files”
External sources
If the sources aren’t available locally, e.g., for a NuGet package, then there is a system called SourceLink that is extremely well-supported in the .NET world that makes it possible to easily download the source files that generated a DLL and that are referenced by its PDB.
Things to be aware of:
- The package must have been built with SourceLink enabled (see producing packages).
- The sources must be available for download in a known format and structure (e.g., Azure Git Repos).
- The IDE must know how to download, cache, and use the sources for debugging or navigation.
If the package does not support SourceLink, but the sources are available, then you can download the sources locally and use the solution-level mapping above to tell the debugger where the source files are. You can also just point the debugger to the top-level folder when it asks for the file’s location, in which case the debugger makes the entry for you.
Navigation
A developer navigates by requesting the source code for a symbol. For example, if the declared type of a variable in an open source file is the class Setting, then the developer can ask the IDE to show the source of Setting by Ctrl + clicking, by pressing F12 in Visual Studio, or by pressing Ctrl + B in Rider.
As with debugging, navigating local sources is straightforward, since the sources are in the local file system. For symbols in NuGet packages, the IDE has to be clever enough to download, cache, and use the sources.
Visual Studio on its own does not support navigating to external sources via SourceLink. Instead, it always decompiles external sources, as shown in the example below.
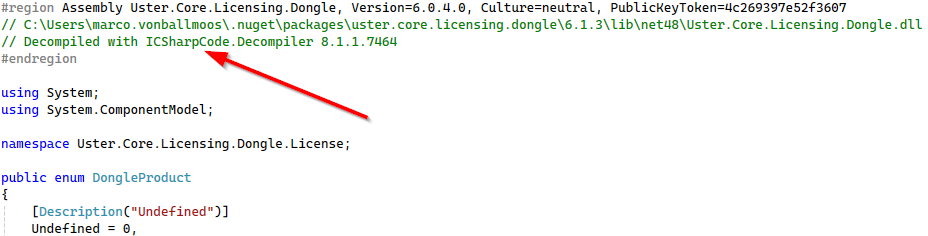 Visual Studio decompiles external sources on navigation
If you have ReSharper installed, then the default setting is to try as hard as possible to avoid showing a decompiled version.
You can also add “Folder Substitutions” in the “Advanced Symbol options…” for navigating to “External Sources”. The option does not seem to be available in Rider.
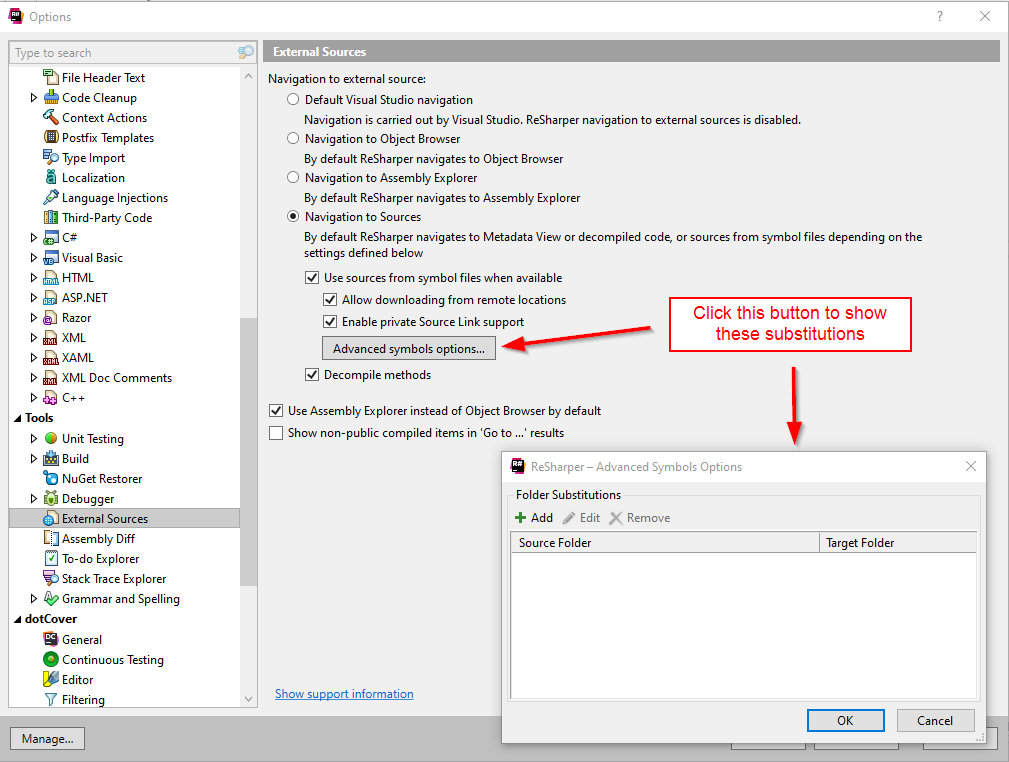 ReSharper External Source Options
SourceLink
SourceLink is a system that provides source files for external sources like NuGet packages for debugging or navigation. In order for this to work, you must be able to provide external sources or the client is not properly configured for debugging.
See below for troubleshooting information, especially as relates to authentication for packages and source code pulled from authenticated locations.
Decompiled code
A decompiled version of the source code is a reconstruction of the original source from the instructions and information in the DLL and PDB. When sources cannot be located for a given symbol, Visual Studio, ReSharper, and Rider will produce a decompiled version as a fallback.
This is often good enough to be able to read the code reasonably well, but it leaves certain common constructs in their “lowered” format. E.g., calls to extension methods appear as static-method calls rather than as targeted on the first parameter.
This can make debugging difficult, as the instructions don’t match the mapping. Rider has support for patching the PDB on-the-fly to allow more comfortable debugging of decompiled sources. This is, however, a fallback solution for external packages over which you have no control. It’s best to configure your packages to publish with symbols and sources available to IDEs that support them, as shown in the next section.
Producing packages
The documentation to Enable debugging and diagnostics with Source Link is thorough and tells you all you need to know about all of the options.
If you’re working with Azure DevOps Services, you should include the following package reference:
<ItemGroup>
  <PackageReference Include="Microsoft.SourceLink.AzureRepos.Git" Version="8.0.0" PrivateAssets="All"/>
</ItemGroup>
With this, you’re all set. The package is published to the Azure Artifacts, with a corresponding snupkg available on the Azure symbol server and sources available via the repository URL (subject to authorization; see below for troubleshooting).
Additional Properties
You can set a few optional properties, detailed below. Most projects won’t need to set these, but they are included to spare you the research if you see them in code examples, either in your institution’s code or online. As noted, the only line you need is the package reference shown above.
- EmbedAllSources
- Embeds all project source files into the generated PDB
- EmbedUntrackedSources
- Embeds anything that’s not included in source control (kind of unclear what they’re talking about here, though); included in
IncludeSymbols - PublishRepositoryUrl
- Ensures that the URL of the repository supplied by the CI server or retrieved from source control manager is available in the package information. This is off by default to prevent discovery of private URLS, but it doesn’t really matter for packages published from private sources, as they are protected by Azure DevOps (or whatever) authorization.
- IncludeSymbols
- Indicates that the PDB should be generated and included either with the package (if
DebugTypeis set toembedded) or in a separate symbol package (ifSymbolPackageFormatis set tosnupkg). This is implied when the NuGet package Microsoft.SourceLink.AzureRepos.Git is included, as shown below. - SymbolPackageFormat
- Indicates which package format to use. This is set to
snupkgwhen the NuGet package Microsoft.SourceLink.AzureRepos.Git is included, as shown below.
See the SourceLink documentation for more details. Among other details, they also note that projects that target .NET 8 no longer need to include this support explicitly because Azure Repos are supported by default, as detailed in the readme for the SourceLink project.
“If your project uses .NET SDK 8+ and is hosted by the above providers (GitHub, Azure Repos, GitLab, BitBucket) it does not need to reference any Source Link packages or set any build properties.”
Conditional packaging
You can also include the packaging conditionally in the Directory.Build.Targets, as shown below.
<ItemGroup Condition=" '$(Configuration)|$(Platform)' == 'Debug|AnyCPU' ">
  <PackageReference Include="Microsoft.SourceLink.AzureRepos.Git" Version="8.0.0" PrivateAssets="All"/>
</ItemGroup>
See the appendix for Directory.Build.Props and Directory.Build.Targets for more information about which variables and directives are respected in which file.
Consuming packages
For debugging
If a package has SourceLink enabled and you have access to the online repository from which it was built, then to seamlessly debug into that source code, ensure the following:
For navigation
As noted above, Visual Studio doesn’t support navigating via SourceLink. To browse external sources with JetBrains tools, ensure the following:
Troubleshooting
Symbols not loaded
Disable Just My Code
Once you’re sure that the package supports SourceLink, then you should also make sure that the Just My Code setting is disabled.
When Just My Code is enabled, the debugger skips over any code that doesn’t correspond to source code in one of the local projects.
Is it available?
- Does the package you’ve downloaded actually include symbols (a
.pdbfile next to the.dllfile)? - If the
PDBis not included with the package, is it available on a Symbol Server? - If it is included, is it being copied into the output folder with the
DLL?
If it’s available in the package, but is not being copied to the output folder, then if you’re using .NET 7.0 SDK or higher, you can use the build property named CopyDebugSymbolFilesFromPackages.
<PropertyGroup Condition=" '$(Configuration)|$(Platform)' == 'Debug|AnyCPU' ">
  <CopyDebugSymbolFilesFromPackages>true</CopyDebugSymbolFilesFromPackages>
</PropertyGroup>
Manually load the module
Verify that the symbols for the module you’re trying to debug have been loaded. If they aren’t loaded, you can try to load symbols while debugging. For more details and a screenshot, see Just My Code debugging.
Decompiling rather than downloading
If you’re trying to navigate in code, but ReSharper or Rider keeps decompiling instead of getting the sources from SourceLink, then check your External Sources settings in ReSharper or Rider. Verify that the tool is configured to check for external sources before it tries decompiling.
If the IDE is having trouble authenticating, then you will usually see a decompiled version instead. Sometimes the code is so close to the original that it’s hard to tell; scroll to the top to see if it includes the “decompiled by JetBrains…” header.
Once the IDE has decompiled a source file, it will continue to use this cached copy until you close the tab, or sometimes you have to close and re-open the project. If you’re troubleshooting your way through this setup, then you can temporarily disable decompilation as a fallback, which avoids producing the unwanted source-code variant in the first place.
Authentication fails
Visual Studio uses the authentication associated with the logged-in user that you use to enable the IDE. This can be in a weird state if you’ve recently changed your password or your authentication token is stale or in a non-refreshable state. Try logging out and back in.
JetBrains tools (Rider, ReSharper, DotPeek, etc.), on the other hand, need to be given a token.
Configure from the notification
If the tool shows a notification indicating that authentication has failed, then do the following:
- Click
Configureon the notification to show a dialog - In the resulting dialog, set:
- User name to your Azure login, e.g.,
john.doe@example.com - Token to an Azure PAT (click for instructions on how to create one)
- Press the
Testbutton to verify that it works (you should seeOK 200) - Press
Okto save the credentials
- User name to your Azure login, e.g.,
Bug in JetBrains tools
However, there is a bug whereby JetBrains tools fail to show a notification or offer a way to enter credentials.[1] That’s going to look something like this:
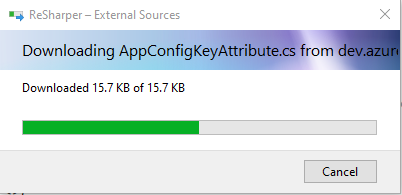
It claims that it can download the source, but it never completes. You have to cancel the dialog. If you then look at the ReSharper Output, then you’ll see something like this:

The relevant text is at the end of the third line, which indicates that the request for the source file returned a “Non-OK HTTP status code”.
PdbNavigator: Searching for 'Example.Core.AppConfig.AppConfigKeyAttribute' type sources in C:\Users\john.doe\.nuget\packages\example.core.appconfig\4.1.0\lib\netstandard2.0\Example.Core.AppConfig.pdb
PdbNavigator: File names (1) are inferred for type Example.Core.AppConfig.AppConfigKeyAttribute
PdbNavigator: Downloader: https://dev.azure.com/example/example.Core/_apis/git/repositories/Example.Core.LabInstruments/items?api-version=1.0&versionType=commit&version=8b34c2aa672facd47e835c27152f695fa796a408&path=/Example.Core/DotNetStandard/Example.Core.AppConfig/AppConfigKeyAttribute.cs -> Non-OK HTTP status code
Configure from the Credentials Manager
The most reliable way to fix this is to create the credentials in the Credential Manager. Be aware that you will need to create an Azure PAT (personal access token).
- Open Credentials Manager
- Switch to
Windows Credentials - Scroll until you see
JetBrains SourceLink https://dev.azure.com/exampleOrganization
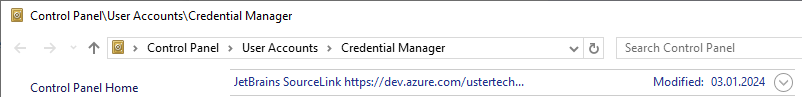 JetBrains entry in Credentials Manager
If you don’t have this entry, then that’s the problem. If you have it, but you still can’t get the sources, then edit the entry to have valid credentials.
To create or edit the record, do the following from the Credentials Manager:
Press
Add a generic credential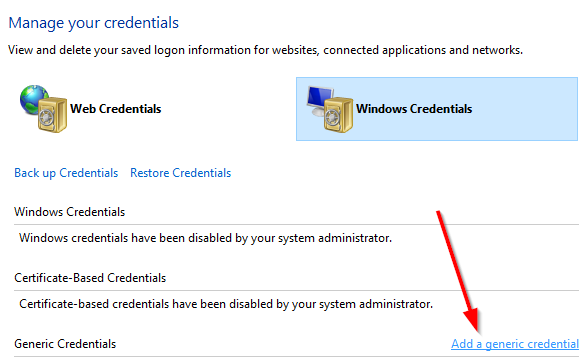
- In the resulting form, set:
- Internet or network address to
JetBrains SourceLink https://dev.azure.com/exampleOrganization - User name to your Azure login, e.g.,
john.doe@example.com - Password to an Azure PAT (click for instructions on how to create one)
- Internet or network address to
💡 There is no need to restart the JetBrains tools. You will immediately be able to load sources from SourceLink once valid credentials exist.
Alternative: referencing projects, not packages
As you can see above, although publishing a package is relatively straightforward, there are quite a few stumbling blocks on the way to consuming the package for navigation and debugging. Once you have everything set up and working, it’s great, but … there is still one other drawback.
You can’t edit the code for packages.
This is not optimal. Optimally, we’d like to quickly verify that change to an upstream code would address an issue in downstream code without having to generate new packages. It would be great to just edit the upstream code as if it were part of your downstream solution until you’re sure that the change would address your downstream issue. At that point, you can copy the changes back to the upstream solution (where the dependency is produced), add tests, and produce a new version, being pretty certain that the change is effective.
The shortest possible developer-feedback loop with code in external packages is:
- Determine that you need to make a change to code in an external package
- Open the solution for that package
- Make the change
- Build the assembly
- Drop it into your output folder (along with the
PDB) - Build and run your solution with the updated code
If your package has dependencies or your change in the external package’s solution touches multiple packages, then you can do the following:
- Build packages for the solution locally
- Set up a NuGet source that points to that folder
- Update to the newer versions of the packages and restore from that source
- Build and run your solution with the updated code
If it get too complicated to do locally, then you can always commit, push, and have the CI generate new versions of your packages (hopefully with a prerelease version, e.g., 3.2.4-preview2)
The solutions outlined above have a reasonable turnaround time, but sometimes you want to pretend that the external packages are just internal projects instead. This basically entails:
- Downloading the project or projects corresponding to the packages that you want to be able to edit
- Including those projects into your solution
- Replacing the external package-references with project references
At that point, you can edit, debug, and navigate the code as if it were your own.
See the “Project Munging with Tools & PowerShell” section of How to Debug NuGet Packages with Symbols and Source Link Painlessly for a PowerShell script that can help you automate part of this.
Directory.Build.Props and Directory.Build.Targets
MSBuild supports including common configuration in project files. While earlier versions required all configuration to be included explicitly, modern versions include configuration files with special names automatically, greatly simplifying common configuration and reducing clutter in project files.
Mechanics
If the file is named Directory.Build.Props or Directory.Build.Targets, it is picked up automatically and included for all projects in that folder or any subfolder. If you use a different name, then you have to explicitly reference that file from a project or from another *.props or *.targets file. If you choose your own name, you don’t have to use the Build.Properties or Build.Targets convention, but it’s strongly recommended, to avoid confusion.
Directory.Build.Props
You can use a Directory.Build.Properties file to include settings for all projects in a folder or set of subfolders.
For example, the following package reference can and should be included in Directory.Build.Props:
<PackageReference Include="Microsoft.SourceLink.AzureRepos.Git" Version="8.0.0" PrivateAssets="All"/>Directory.Build.Targets
If you want to include settings conditionally based on build configuration (e.g., Configuration or Platform), then you’ll have to use the Directory.Build.Targets file, which has access to those variables.
<ItemGroup Condition=" '$(Configuration)|$(Platform)' == 'Debug|AnyCPU' ">
  <PackageReference Include="Microsoft.SourceLink.AzureRepos.Git" Version="8.0.0" PrivateAssets="All"/>
</ItemGroup>
Rules-of-thumb
- Once you’re using the SDK-style format for project files[2], you can aggressively consolidate common settings in a
Directory.Build.Propsfile at the root of the solution. - If you have groups of projects to which different settings should be applied, then consider splitting those off into corresponding subfolders (e.g., “Tests”) so that you can apply those common settings with a configuration file that applies only to that folder.
- If you can’t or don’t want to move projects into subfolders, then you can create a custom `props` file and manually include it in the project files that need it.
[1] After having figured out a workaround, I felt well-equipped enough to file a bug with JetBrains: ReSharper does not ask for authentication when browsing to source from symbol files in assembly explorer. After a couple of days, the responsible developer changed the status from “triage” to “open” and he linked a two-year-old bug report to it: Pdb files cannot be downloaded from Azure DevOps Symbol Server. Would you like to guess who wrote that bug report? Yours truly. I knew I’d had trouble in this area before, but I’d completely forgotten that I’d reported the bug in such detail. It’s still open. Maybe they’ll finally address it.↩
[2] This also works for the older project format, but it’s hard to keep Visual Studio from repopulating properties in that format. You can use the SDK-style format for nearly all projects these days. The conversion is worth it.↩